Native/Alaskan vs Immigrants Householder Income Under 25 years
COMPARE
Native/Alaskan
Immigrants
Householder Income Under 25 years
Householder Income Under 25 years Comparison
Natives/Alaskans
Immigrants
$47,704
HOUSEHOLDER INCOME UNDER 25 YEARS
0.0/ 100
METRIC RATING
306th/ 347
METRIC RANK
$53,201
HOUSEHOLDER INCOME UNDER 25 YEARS
92.2/ 100
METRIC RATING
133rd/ 347
METRIC RANK
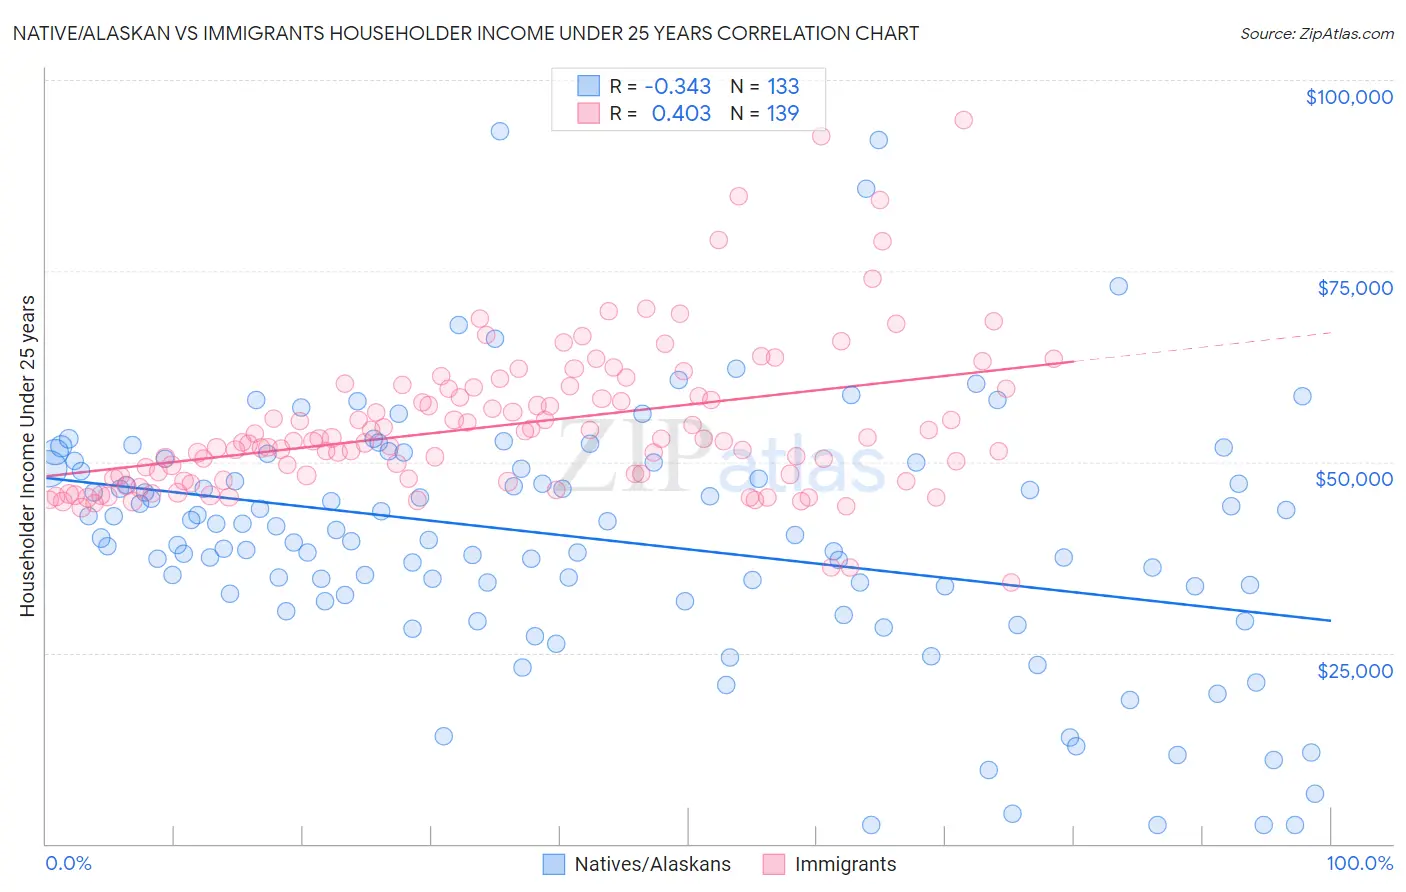
Native/Alaskan vs Immigrants Householder Income Under 25 years Correlation Chart
The statistical analysis conducted on geographies consisting of 416,135,889 people shows a mild negative correlation between the proportion of Natives/Alaskans and household income with householder under the age of 25 in the United States with a correlation coefficient (R) of -0.343 and weighted average of $47,704. Similarly, the statistical analysis conducted on geographies consisting of 440,888,277 people shows a moderate positive correlation between the proportion of Immigrants and household income with householder under the age of 25 in the United States with a correlation coefficient (R) of 0.403 and weighted average of $53,201, a difference of 11.5%.
Householder Income Under 25 years Correlation Summary
| Measurement | Native/Alaskan | Immigrants |
| Minimum | $2,499 | $34,271 |
| Maximum | $93,365 | $94,688 |
| Range | $90,866 | $60,417 |
| Mean | $40,011 | $54,792 |
| Median | $40,469 | $52,736 |
| Interquartile 25% (IQ1) | $32,640 | $47,750 |
| Interquartile 75% (IQ3) | $49,547 | $59,631 |
| Interquartile Range (IQR) | $16,907 | $11,881 |
| Standard Deviation (Sample) | $16,339 | $9,932 |
| Standard Deviation (Population) | $16,277 | $9,896 |
Similar Demographics by Householder Income Under 25 years
Demographics Similar to Natives/Alaskans by Householder Income Under 25 years
In terms of householder income under 25 years, the demographic groups most similar to Natives/Alaskans are Bangladeshi ($47,589, a difference of 0.24%), Cherokee ($47,848, a difference of 0.30%), Comanche ($47,518, a difference of 0.39%), Menominee ($47,907, a difference of 0.43%), and Immigrants from Middle Africa ($47,916, a difference of 0.44%).
| Demographics | Rating | Rank | Householder Income Under 25 years |
| Immigrants | Honduras | 0.0 /100 | #299 | Tragic $48,267 |
| Immigrants | Somalia | 0.0 /100 | #300 | Tragic $48,135 |
| Immigrants | Kuwait | 0.0 /100 | #301 | Tragic $48,126 |
| Immigrants | Liberia | 0.0 /100 | #302 | Tragic $47,981 |
| Immigrants | Middle Africa | 0.0 /100 | #303 | Tragic $47,916 |
| Menominee | 0.0 /100 | #304 | Tragic $47,907 |
| Cherokee | 0.0 /100 | #305 | Tragic $47,848 |
| Natives/Alaskans | 0.0 /100 | #306 | Tragic $47,704 |
| Bangladeshis | 0.0 /100 | #307 | Tragic $47,589 |
| Comanche | 0.0 /100 | #308 | Tragic $47,518 |
| U.S. Virgin Islanders | 0.0 /100 | #309 | Tragic $47,448 |
| Iroquois | 0.0 /100 | #310 | Tragic $47,380 |
| Ottawa | 0.0 /100 | #311 | Tragic $47,366 |
| Bermudans | 0.0 /100 | #312 | Tragic $47,359 |
| Delaware | 0.0 /100 | #313 | Tragic $47,159 |
Demographics Similar to Immigrants by Householder Income Under 25 years
In terms of householder income under 25 years, the demographic groups most similar to Immigrants are Immigrants from Northern Africa ($53,185, a difference of 0.030%), Chilean ($53,185, a difference of 0.030%), Armenian ($53,179, a difference of 0.040%), Immigrants from Barbados ($53,163, a difference of 0.070%), and Moroccan ($53,256, a difference of 0.10%).
| Demographics | Rating | Rank | Householder Income Under 25 years |
| Immigrants | Serbia | 94.1 /100 | #126 | Exceptional $53,321 |
| Immigrants | North America | 93.9 /100 | #127 | Exceptional $53,307 |
| Immigrants | Bulgaria | 93.9 /100 | #128 | Exceptional $53,305 |
| New Zealanders | 93.7 /100 | #129 | Exceptional $53,294 |
| Nicaraguans | 93.4 /100 | #130 | Exceptional $53,275 |
| Immigrants | Nicaragua | 93.3 /100 | #131 | Exceptional $53,266 |
| Moroccans | 93.1 /100 | #132 | Exceptional $53,256 |
| Immigrants | Immigrants | 92.2 /100 | #133 | Exceptional $53,201 |
| Immigrants | Northern Africa | 91.9 /100 | #134 | Exceptional $53,185 |
| Chileans | 91.9 /100 | #135 | Exceptional $53,185 |
| Armenians | 91.8 /100 | #136 | Exceptional $53,179 |
| Immigrants | Barbados | 91.5 /100 | #137 | Exceptional $53,163 |
| Norwegians | 90.8 /100 | #138 | Exceptional $53,127 |
| Costa Ricans | 90.4 /100 | #139 | Exceptional $53,106 |
| Hawaiians | 89.8 /100 | #140 | Excellent $53,078 |