Egyptian vs Yugoslavian Householder Income Under 25 years
COMPARE
Egyptian
Yugoslavian
Householder Income Under 25 years
Householder Income Under 25 years Comparison
Egyptians
Yugoslavians
$54,444
HOUSEHOLDER INCOME UNDER 25 YEARS
99.6/ 100
METRIC RATING
80th/ 347
METRIC RANK
$51,028
HOUSEHOLDER INCOME UNDER 25 YEARS
5.5/ 100
METRIC RATING
226th/ 347
METRIC RANK
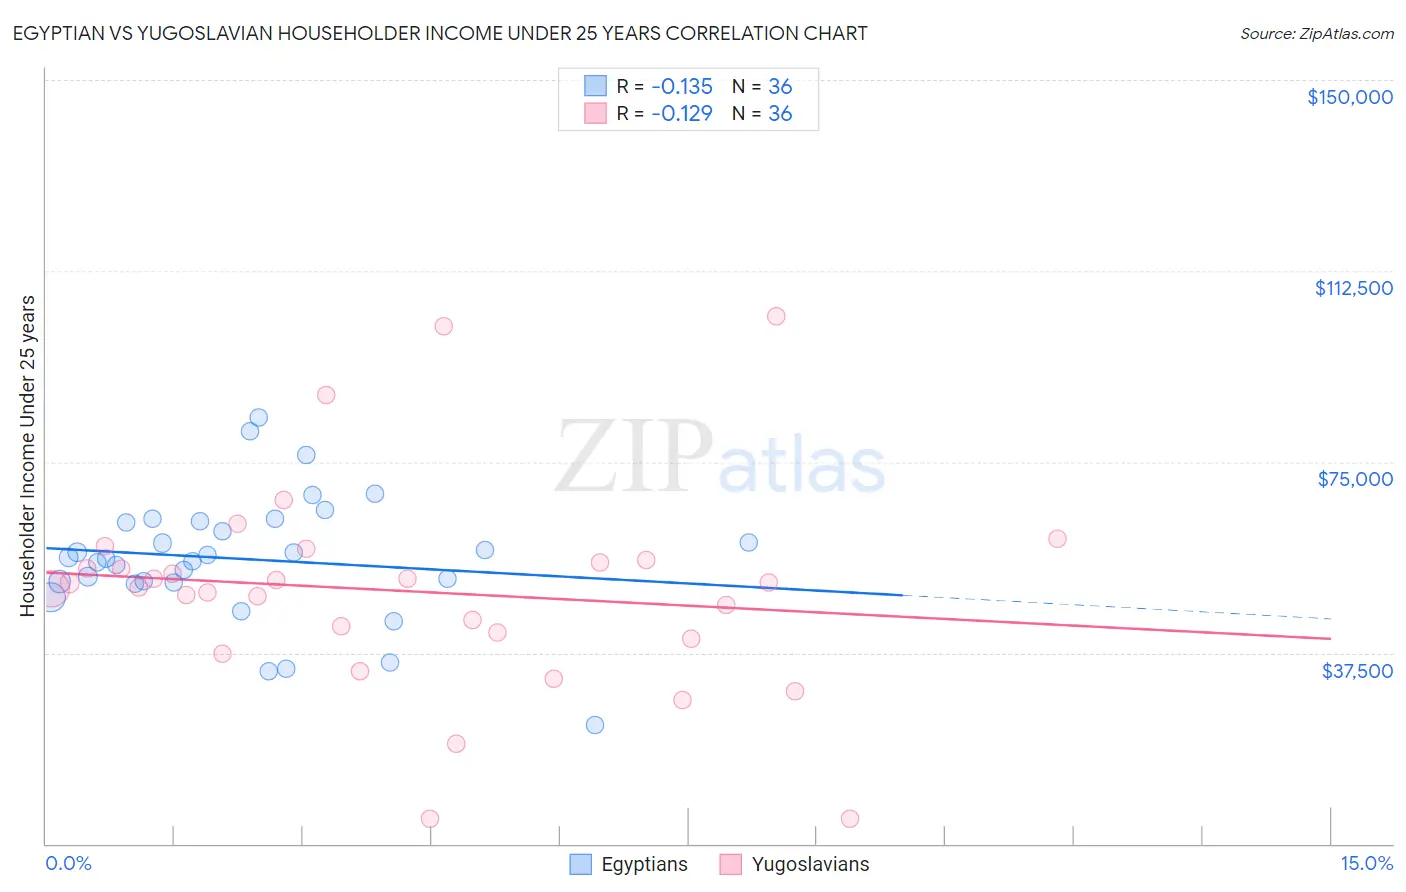
Egyptian vs Yugoslavian Householder Income Under 25 years Correlation Chart
The statistical analysis conducted on geographies consisting of 240,038,174 people shows a poor negative correlation between the proportion of Egyptians and household income with householder under the age of 25 in the United States with a correlation coefficient (R) of -0.135 and weighted average of $54,444. Similarly, the statistical analysis conducted on geographies consisting of 250,106,142 people shows a poor negative correlation between the proportion of Yugoslavians and household income with householder under the age of 25 in the United States with a correlation coefficient (R) of -0.129 and weighted average of $51,028, a difference of 6.7%.
Householder Income Under 25 years Correlation Summary
| Measurement | Egyptian | Yugoslavian |
| Minimum | $23,214 | $4,881 |
| Maximum | $83,750 | $103,500 |
| Range | $60,536 | $98,619 |
| Mean | $55,910 | $49,574 |
| Median | $56,055 | $50,803 |
| Interquartile 25% (IQ1) | $51,447 | $40,912 |
| Interquartile 75% (IQ3) | $63,229 | $55,573 |
| Interquartile Range (IQR) | $11,783 | $14,662 |
| Standard Deviation (Sample) | $12,425 | $20,475 |
| Standard Deviation (Population) | $12,251 | $20,189 |
Similar Demographics by Householder Income Under 25 years
Demographics Similar to Egyptians by Householder Income Under 25 years
In terms of householder income under 25 years, the demographic groups most similar to Egyptians are Immigrants from Italy ($54,449, a difference of 0.010%), Portuguese ($54,436, a difference of 0.010%), Nepalese ($54,472, a difference of 0.050%), Immigrants from Southern Europe ($54,484, a difference of 0.070%), and Immigrants from Brazil ($54,487, a difference of 0.080%).
| Demographics | Rating | Rank | Householder Income Under 25 years |
| Macedonians | 99.7 /100 | #73 | Exceptional $54,563 |
| Immigrants | Grenada | 99.7 /100 | #74 | Exceptional $54,538 |
| Immigrants | Sri Lanka | 99.7 /100 | #75 | Exceptional $54,512 |
| Immigrants | Brazil | 99.6 /100 | #76 | Exceptional $54,487 |
| Immigrants | Southern Europe | 99.6 /100 | #77 | Exceptional $54,484 |
| Nepalese | 99.6 /100 | #78 | Exceptional $54,472 |
| Immigrants | Italy | 99.6 /100 | #79 | Exceptional $54,449 |
| Egyptians | 99.6 /100 | #80 | Exceptional $54,444 |
| Portuguese | 99.6 /100 | #81 | Exceptional $54,436 |
| Russians | 99.5 /100 | #82 | Exceptional $54,389 |
| Laotians | 99.5 /100 | #83 | Exceptional $54,369 |
| Bulgarians | 99.5 /100 | #84 | Exceptional $54,352 |
| Immigrants | Czechoslovakia | 99.5 /100 | #85 | Exceptional $54,352 |
| Immigrants | Croatia | 99.5 /100 | #86 | Exceptional $54,343 |
| Brazilians | 99.5 /100 | #87 | Exceptional $54,335 |
Demographics Similar to Yugoslavians by Householder Income Under 25 years
In terms of householder income under 25 years, the demographic groups most similar to Yugoslavians are Immigrants from Central America ($51,022, a difference of 0.010%), Immigrants from Jamaica ($51,038, a difference of 0.020%), Immigrants from Norway ($50,984, a difference of 0.090%), Belizean ($51,094, a difference of 0.13%), and Serbian ($51,106, a difference of 0.15%).
| Demographics | Rating | Rank | Householder Income Under 25 years |
| Arabs | 8.5 /100 | #219 | Tragic $51,219 |
| Immigrants | Germany | 8.0 /100 | #220 | Tragic $51,190 |
| Immigrants | Eastern Africa | 7.4 /100 | #221 | Tragic $51,158 |
| Spaniards | 6.8 /100 | #222 | Tragic $51,117 |
| Serbians | 6.6 /100 | #223 | Tragic $51,106 |
| Belizeans | 6.4 /100 | #224 | Tragic $51,094 |
| Immigrants | Jamaica | 5.6 /100 | #225 | Tragic $51,038 |
| Yugoslavians | 5.5 /100 | #226 | Tragic $51,028 |
| Immigrants | Central America | 5.4 /100 | #227 | Tragic $51,022 |
| Immigrants | Norway | 5.0 /100 | #228 | Tragic $50,984 |
| Yuman | 4.4 /100 | #229 | Tragic $50,933 |
| Jamaicans | 4.4 /100 | #230 | Tragic $50,929 |
| Ugandans | 4.3 /100 | #231 | Tragic $50,923 |
| Slovenes | 4.0 /100 | #232 | Tragic $50,886 |
| Pennsylvania Germans | 3.7 /100 | #233 | Tragic $50,852 |