Native/Alaskan vs Arab Householder Income Under 25 years
COMPARE
Native/Alaskan
Arab
Householder Income Under 25 years
Householder Income Under 25 years Comparison
Natives/Alaskans
Arabs
$47,704
HOUSEHOLDER INCOME UNDER 25 YEARS
0.0/ 100
METRIC RATING
306th/ 347
METRIC RANK
$51,219
HOUSEHOLDER INCOME UNDER 25 YEARS
8.5/ 100
METRIC RATING
219th/ 347
METRIC RANK
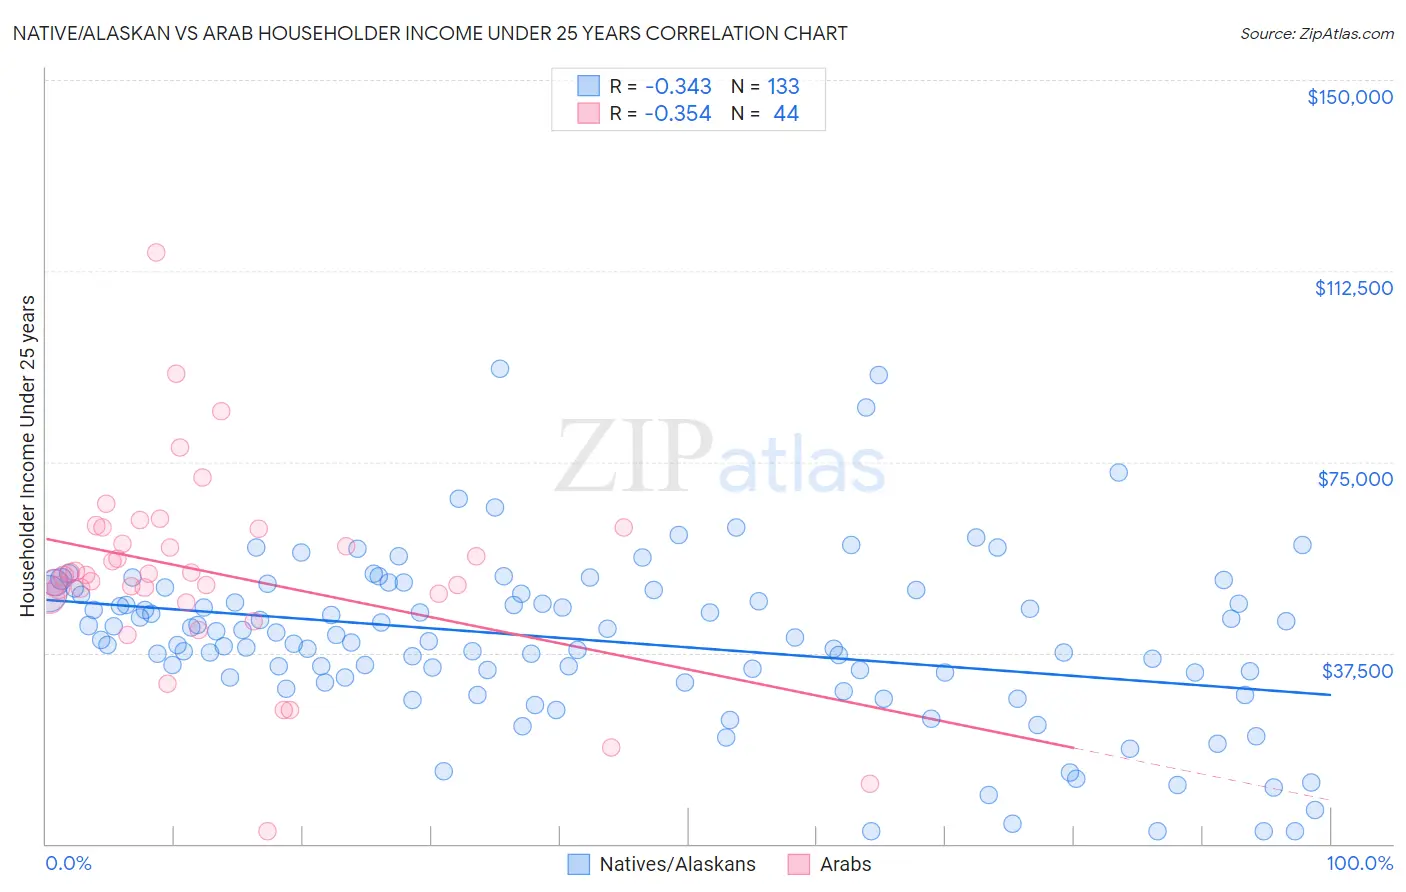
Native/Alaskan vs Arab Householder Income Under 25 years Correlation Chart
The statistical analysis conducted on geographies consisting of 416,135,889 people shows a mild negative correlation between the proportion of Natives/Alaskans and household income with householder under the age of 25 in the United States with a correlation coefficient (R) of -0.343 and weighted average of $47,704. Similarly, the statistical analysis conducted on geographies consisting of 397,690,882 people shows a mild negative correlation between the proportion of Arabs and household income with householder under the age of 25 in the United States with a correlation coefficient (R) of -0.354 and weighted average of $51,219, a difference of 7.4%.
Householder Income Under 25 years Correlation Summary
| Measurement | Native/Alaskan | Arab |
| Minimum | $2,499 | $2,499 |
| Maximum | $93,365 | $116,189 |
| Range | $90,866 | $113,690 |
| Mean | $40,011 | $53,228 |
| Median | $40,469 | $52,860 |
| Interquartile 25% (IQ1) | $32,640 | $48,642 |
| Interquartile 75% (IQ3) | $49,547 | $61,942 |
| Interquartile Range (IQR) | $16,907 | $13,300 |
| Standard Deviation (Sample) | $16,339 | $19,395 |
| Standard Deviation (Population) | $16,277 | $19,173 |
Similar Demographics by Householder Income Under 25 years
Demographics Similar to Natives/Alaskans by Householder Income Under 25 years
In terms of householder income under 25 years, the demographic groups most similar to Natives/Alaskans are Bangladeshi ($47,589, a difference of 0.24%), Cherokee ($47,848, a difference of 0.30%), Comanche ($47,518, a difference of 0.39%), Menominee ($47,907, a difference of 0.43%), and Immigrants from Middle Africa ($47,916, a difference of 0.44%).
| Demographics | Rating | Rank | Householder Income Under 25 years |
| Immigrants | Honduras | 0.0 /100 | #299 | Tragic $48,267 |
| Immigrants | Somalia | 0.0 /100 | #300 | Tragic $48,135 |
| Immigrants | Kuwait | 0.0 /100 | #301 | Tragic $48,126 |
| Immigrants | Liberia | 0.0 /100 | #302 | Tragic $47,981 |
| Immigrants | Middle Africa | 0.0 /100 | #303 | Tragic $47,916 |
| Menominee | 0.0 /100 | #304 | Tragic $47,907 |
| Cherokee | 0.0 /100 | #305 | Tragic $47,848 |
| Natives/Alaskans | 0.0 /100 | #306 | Tragic $47,704 |
| Bangladeshis | 0.0 /100 | #307 | Tragic $47,589 |
| Comanche | 0.0 /100 | #308 | Tragic $47,518 |
| U.S. Virgin Islanders | 0.0 /100 | #309 | Tragic $47,448 |
| Iroquois | 0.0 /100 | #310 | Tragic $47,380 |
| Ottawa | 0.0 /100 | #311 | Tragic $47,366 |
| Bermudans | 0.0 /100 | #312 | Tragic $47,359 |
| Delaware | 0.0 /100 | #313 | Tragic $47,159 |
Demographics Similar to Arabs by Householder Income Under 25 years
In terms of householder income under 25 years, the demographic groups most similar to Arabs are Czechoslovakian ($51,224, a difference of 0.010%), Immigrants from Belize ($51,223, a difference of 0.010%), French ($51,230, a difference of 0.020%), Icelander ($51,247, a difference of 0.050%), and Immigrants from Germany ($51,190, a difference of 0.060%).
| Demographics | Rating | Rank | Householder Income Under 25 years |
| Immigrants | Panama | 9.7 /100 | #212 | Tragic $51,278 |
| Dutch | 9.4 /100 | #213 | Tragic $51,265 |
| Zimbabweans | 9.3 /100 | #214 | Tragic $51,259 |
| Icelanders | 9.1 /100 | #215 | Tragic $51,247 |
| French | 8.7 /100 | #216 | Tragic $51,230 |
| Czechoslovakians | 8.6 /100 | #217 | Tragic $51,224 |
| Immigrants | Belize | 8.6 /100 | #218 | Tragic $51,223 |
| Arabs | 8.5 /100 | #219 | Tragic $51,219 |
| Immigrants | Germany | 8.0 /100 | #220 | Tragic $51,190 |
| Immigrants | Eastern Africa | 7.4 /100 | #221 | Tragic $51,158 |
| Spaniards | 6.8 /100 | #222 | Tragic $51,117 |
| Serbians | 6.6 /100 | #223 | Tragic $51,106 |
| Belizeans | 6.4 /100 | #224 | Tragic $51,094 |
| Immigrants | Jamaica | 5.6 /100 | #225 | Tragic $51,038 |
| Yugoslavians | 5.5 /100 | #226 | Tragic $51,028 |