Native/Alaskan vs Tongan Householder Income Under 25 years
COMPARE
Native/Alaskan
Tongan
Householder Income Under 25 years
Householder Income Under 25 years Comparison
Natives/Alaskans
Tongans
$47,704
HOUSEHOLDER INCOME UNDER 25 YEARS
0.0/ 100
METRIC RATING
306th/ 347
METRIC RANK
$56,972
HOUSEHOLDER INCOME UNDER 25 YEARS
100.0/ 100
METRIC RATING
23rd/ 347
METRIC RANK
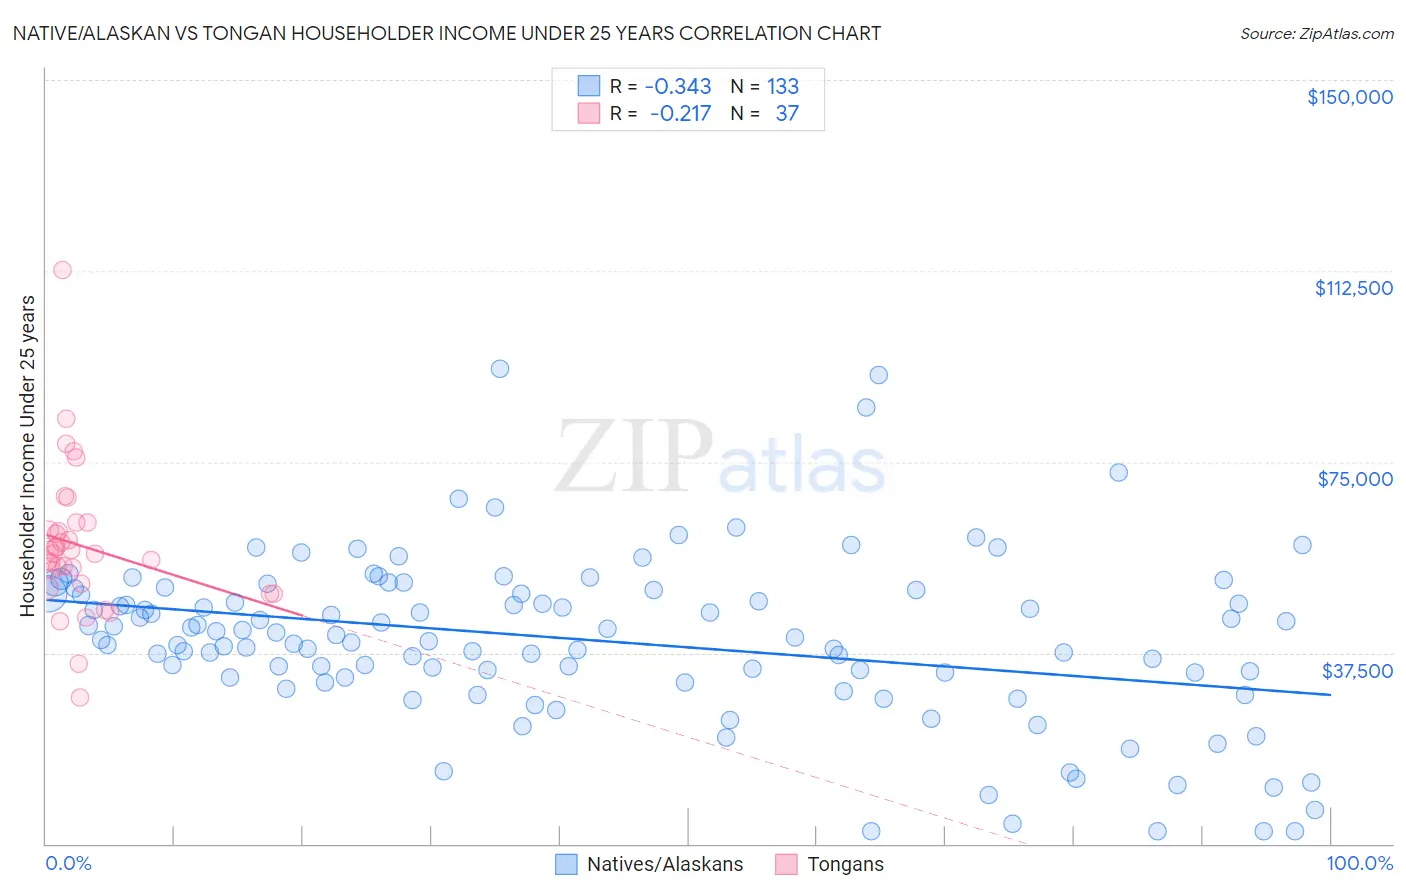
Native/Alaskan vs Tongan Householder Income Under 25 years Correlation Chart
The statistical analysis conducted on geographies consisting of 416,135,889 people shows a mild negative correlation between the proportion of Natives/Alaskans and household income with householder under the age of 25 in the United States with a correlation coefficient (R) of -0.343 and weighted average of $47,704. Similarly, the statistical analysis conducted on geographies consisting of 96,005,188 people shows a weak negative correlation between the proportion of Tongans and household income with householder under the age of 25 in the United States with a correlation coefficient (R) of -0.217 and weighted average of $56,972, a difference of 19.4%.
Householder Income Under 25 years Correlation Summary
| Measurement | Native/Alaskan | Tongan |
| Minimum | $2,499 | $28,696 |
| Maximum | $93,365 | $112,736 |
| Range | $90,866 | $84,040 |
| Mean | $40,011 | $58,510 |
| Median | $40,469 | $56,941 |
| Interquartile 25% (IQ1) | $32,640 | $50,618 |
| Interquartile 75% (IQ3) | $49,547 | $62,342 |
| Interquartile Range (IQR) | $16,907 | $11,724 |
| Standard Deviation (Sample) | $16,339 | $14,382 |
| Standard Deviation (Population) | $16,277 | $14,186 |
Similar Demographics by Householder Income Under 25 years
Demographics Similar to Natives/Alaskans by Householder Income Under 25 years
In terms of householder income under 25 years, the demographic groups most similar to Natives/Alaskans are Bangladeshi ($47,589, a difference of 0.24%), Cherokee ($47,848, a difference of 0.30%), Comanche ($47,518, a difference of 0.39%), Menominee ($47,907, a difference of 0.43%), and Immigrants from Middle Africa ($47,916, a difference of 0.44%).
| Demographics | Rating | Rank | Householder Income Under 25 years |
| Immigrants | Honduras | 0.0 /100 | #299 | Tragic $48,267 |
| Immigrants | Somalia | 0.0 /100 | #300 | Tragic $48,135 |
| Immigrants | Kuwait | 0.0 /100 | #301 | Tragic $48,126 |
| Immigrants | Liberia | 0.0 /100 | #302 | Tragic $47,981 |
| Immigrants | Middle Africa | 0.0 /100 | #303 | Tragic $47,916 |
| Menominee | 0.0 /100 | #304 | Tragic $47,907 |
| Cherokee | 0.0 /100 | #305 | Tragic $47,848 |
| Natives/Alaskans | 0.0 /100 | #306 | Tragic $47,704 |
| Bangladeshis | 0.0 /100 | #307 | Tragic $47,589 |
| Comanche | 0.0 /100 | #308 | Tragic $47,518 |
| U.S. Virgin Islanders | 0.0 /100 | #309 | Tragic $47,448 |
| Iroquois | 0.0 /100 | #310 | Tragic $47,380 |
| Ottawa | 0.0 /100 | #311 | Tragic $47,366 |
| Bermudans | 0.0 /100 | #312 | Tragic $47,359 |
| Delaware | 0.0 /100 | #313 | Tragic $47,159 |
Demographics Similar to Tongans by Householder Income Under 25 years
In terms of householder income under 25 years, the demographic groups most similar to Tongans are Asian ($57,003, a difference of 0.050%), Bhutanese ($57,078, a difference of 0.18%), Immigrants from Ireland ($57,075, a difference of 0.18%), Immigrants from Fiji ($57,074, a difference of 0.18%), and Immigrants from Singapore ($56,835, a difference of 0.24%).
| Demographics | Rating | Rank | Householder Income Under 25 years |
| Immigrants | Afghanistan | 100.0 /100 | #16 | Exceptional $57,478 |
| Sierra Leoneans | 100.0 /100 | #17 | Exceptional $57,272 |
| Immigrants | Eastern Asia | 100.0 /100 | #18 | Exceptional $57,123 |
| Bhutanese | 100.0 /100 | #19 | Exceptional $57,078 |
| Immigrants | Ireland | 100.0 /100 | #20 | Exceptional $57,075 |
| Immigrants | Fiji | 100.0 /100 | #21 | Exceptional $57,074 |
| Asians | 100.0 /100 | #22 | Exceptional $57,003 |
| Tongans | 100.0 /100 | #23 | Exceptional $56,972 |
| Immigrants | Singapore | 100.0 /100 | #24 | Exceptional $56,835 |
| Immigrants | Pakistan | 100.0 /100 | #25 | Exceptional $56,789 |
| Immigrants | Australia | 100.0 /100 | #26 | Exceptional $56,660 |
| Immigrants | North Macedonia | 100.0 /100 | #27 | Exceptional $56,503 |
| Immigrants | Peru | 100.0 /100 | #28 | Exceptional $56,384 |
| Immigrants | Asia | 100.0 /100 | #29 | Exceptional $56,379 |
| Immigrants | Moldova | 100.0 /100 | #30 | Exceptional $56,168 |