Native/Alaskan vs Apache Householder Income Under 25 years
COMPARE
Native/Alaskan
Apache
Householder Income Under 25 years
Householder Income Under 25 years Comparison
Natives/Alaskans
Apache
$47,704
HOUSEHOLDER INCOME UNDER 25 YEARS
0.0/ 100
METRIC RATING
306th/ 347
METRIC RANK
$49,395
HOUSEHOLDER INCOME UNDER 25 YEARS
0.1/ 100
METRIC RATING
279th/ 347
METRIC RANK
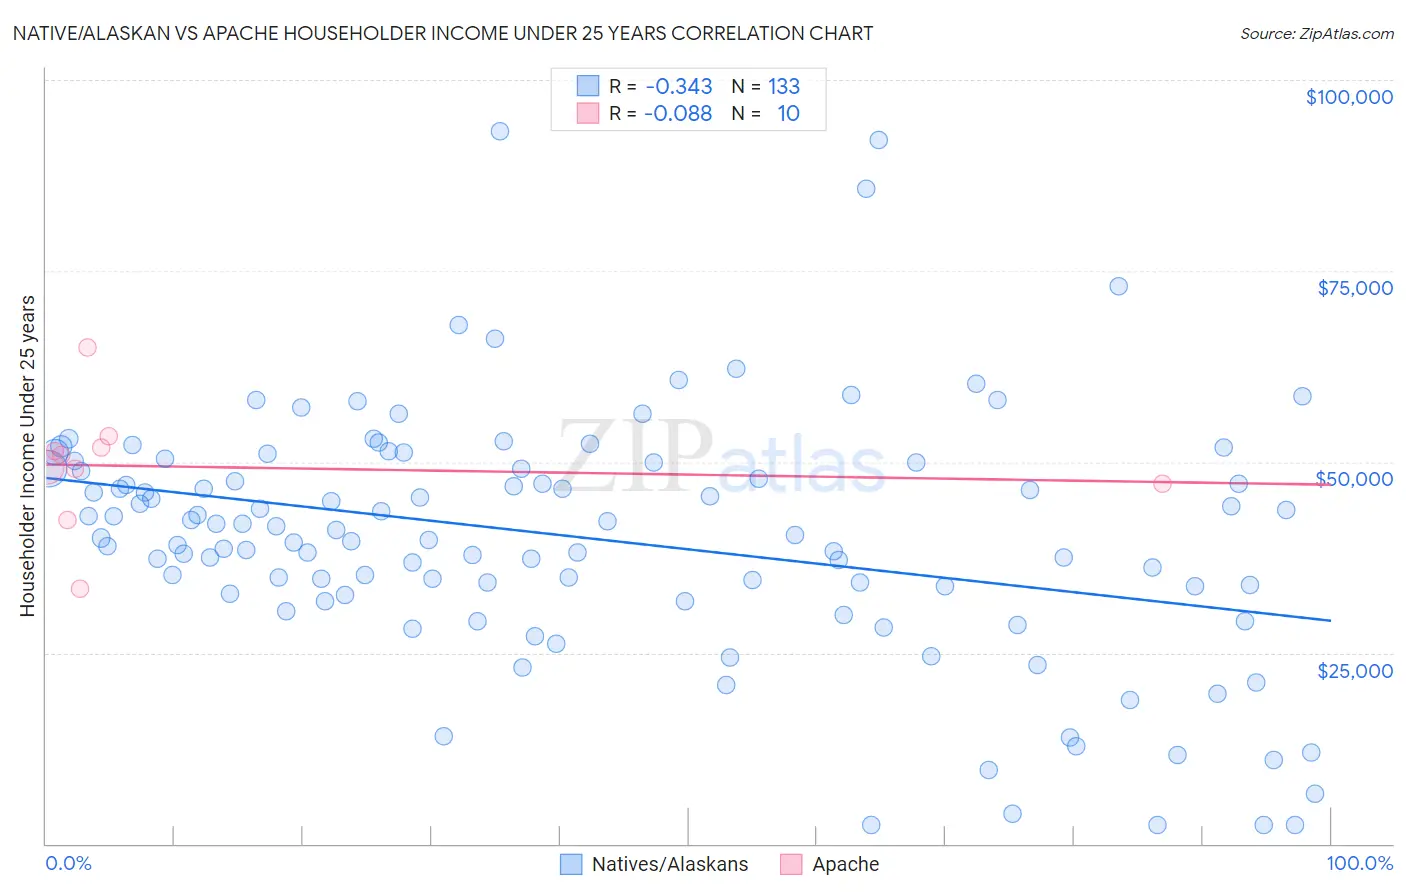
Native/Alaskan vs Apache Householder Income Under 25 years Correlation Chart
The statistical analysis conducted on geographies consisting of 416,135,889 people shows a mild negative correlation between the proportion of Natives/Alaskans and household income with householder under the age of 25 in the United States with a correlation coefficient (R) of -0.343 and weighted average of $47,704. Similarly, the statistical analysis conducted on geographies consisting of 208,884,010 people shows a slight negative correlation between the proportion of Apache and household income with householder under the age of 25 in the United States with a correlation coefficient (R) of -0.088 and weighted average of $49,395, a difference of 3.5%.
Householder Income Under 25 years Correlation Summary
| Measurement | Native/Alaskan | Apache |
| Minimum | $2,499 | $33,347 |
| Maximum | $93,365 | $64,911 |
| Range | $90,866 | $31,564 |
| Mean | $40,011 | $49,372 |
| Median | $40,469 | $50,154 |
| Interquartile 25% (IQ1) | $32,640 | $47,083 |
| Interquartile 75% (IQ3) | $49,547 | $51,895 |
| Interquartile Range (IQR) | $16,907 | $4,812 |
| Standard Deviation (Sample) | $16,339 | $8,028 |
| Standard Deviation (Population) | $16,277 | $7,616 |
Similar Demographics by Householder Income Under 25 years
Demographics Similar to Natives/Alaskans by Householder Income Under 25 years
In terms of householder income under 25 years, the demographic groups most similar to Natives/Alaskans are Bangladeshi ($47,589, a difference of 0.24%), Cherokee ($47,848, a difference of 0.30%), Comanche ($47,518, a difference of 0.39%), Menominee ($47,907, a difference of 0.43%), and Immigrants from Middle Africa ($47,916, a difference of 0.44%).
| Demographics | Rating | Rank | Householder Income Under 25 years |
| Immigrants | Honduras | 0.0 /100 | #299 | Tragic $48,267 |
| Immigrants | Somalia | 0.0 /100 | #300 | Tragic $48,135 |
| Immigrants | Kuwait | 0.0 /100 | #301 | Tragic $48,126 |
| Immigrants | Liberia | 0.0 /100 | #302 | Tragic $47,981 |
| Immigrants | Middle Africa | 0.0 /100 | #303 | Tragic $47,916 |
| Menominee | 0.0 /100 | #304 | Tragic $47,907 |
| Cherokee | 0.0 /100 | #305 | Tragic $47,848 |
| Natives/Alaskans | 0.0 /100 | #306 | Tragic $47,704 |
| Bangladeshis | 0.0 /100 | #307 | Tragic $47,589 |
| Comanche | 0.0 /100 | #308 | Tragic $47,518 |
| U.S. Virgin Islanders | 0.0 /100 | #309 | Tragic $47,448 |
| Iroquois | 0.0 /100 | #310 | Tragic $47,380 |
| Ottawa | 0.0 /100 | #311 | Tragic $47,366 |
| Bermudans | 0.0 /100 | #312 | Tragic $47,359 |
| Delaware | 0.0 /100 | #313 | Tragic $47,159 |
Demographics Similar to Apache by Householder Income Under 25 years
In terms of householder income under 25 years, the demographic groups most similar to Apache are Nigerian ($49,416, a difference of 0.040%), Hmong ($49,364, a difference of 0.060%), Nonimmigrants ($49,348, a difference of 0.090%), Alsatian ($49,267, a difference of 0.26%), and Immigrants from Nigeria ($49,174, a difference of 0.45%).
| Demographics | Rating | Rank | Householder Income Under 25 years |
| Colville | 0.3 /100 | #272 | Tragic $49,774 |
| Slovaks | 0.3 /100 | #273 | Tragic $49,753 |
| Immigrants | Senegal | 0.3 /100 | #274 | Tragic $49,742 |
| Immigrants | Kenya | 0.2 /100 | #275 | Tragic $49,633 |
| Dominicans | 0.2 /100 | #276 | Tragic $49,633 |
| Immigrants | Western Africa | 0.2 /100 | #277 | Tragic $49,621 |
| Nigerians | 0.1 /100 | #278 | Tragic $49,416 |
| Apache | 0.1 /100 | #279 | Tragic $49,395 |
| Hmong | 0.1 /100 | #280 | Tragic $49,364 |
| Immigrants | Nonimmigrants | 0.1 /100 | #281 | Tragic $49,348 |
| Alsatians | 0.1 /100 | #282 | Tragic $49,267 |
| Immigrants | Nigeria | 0.1 /100 | #283 | Tragic $49,174 |
| Carpatho Rusyns | 0.1 /100 | #284 | Tragic $49,113 |
| Scotch-Irish | 0.0 /100 | #285 | Tragic $49,039 |
| French American Indians | 0.0 /100 | #286 | Tragic $48,977 |