Puerto Rican vs Arab Householder Income Under 25 years
COMPARE
Puerto Rican
Arab
Householder Income Under 25 years
Householder Income Under 25 years Comparison
Puerto Ricans
Arabs
$39,726
HOUSEHOLDER INCOME UNDER 25 YEARS
0.0/ 100
METRIC RATING
346th/ 347
METRIC RANK
$51,219
HOUSEHOLDER INCOME UNDER 25 YEARS
8.5/ 100
METRIC RATING
219th/ 347
METRIC RANK
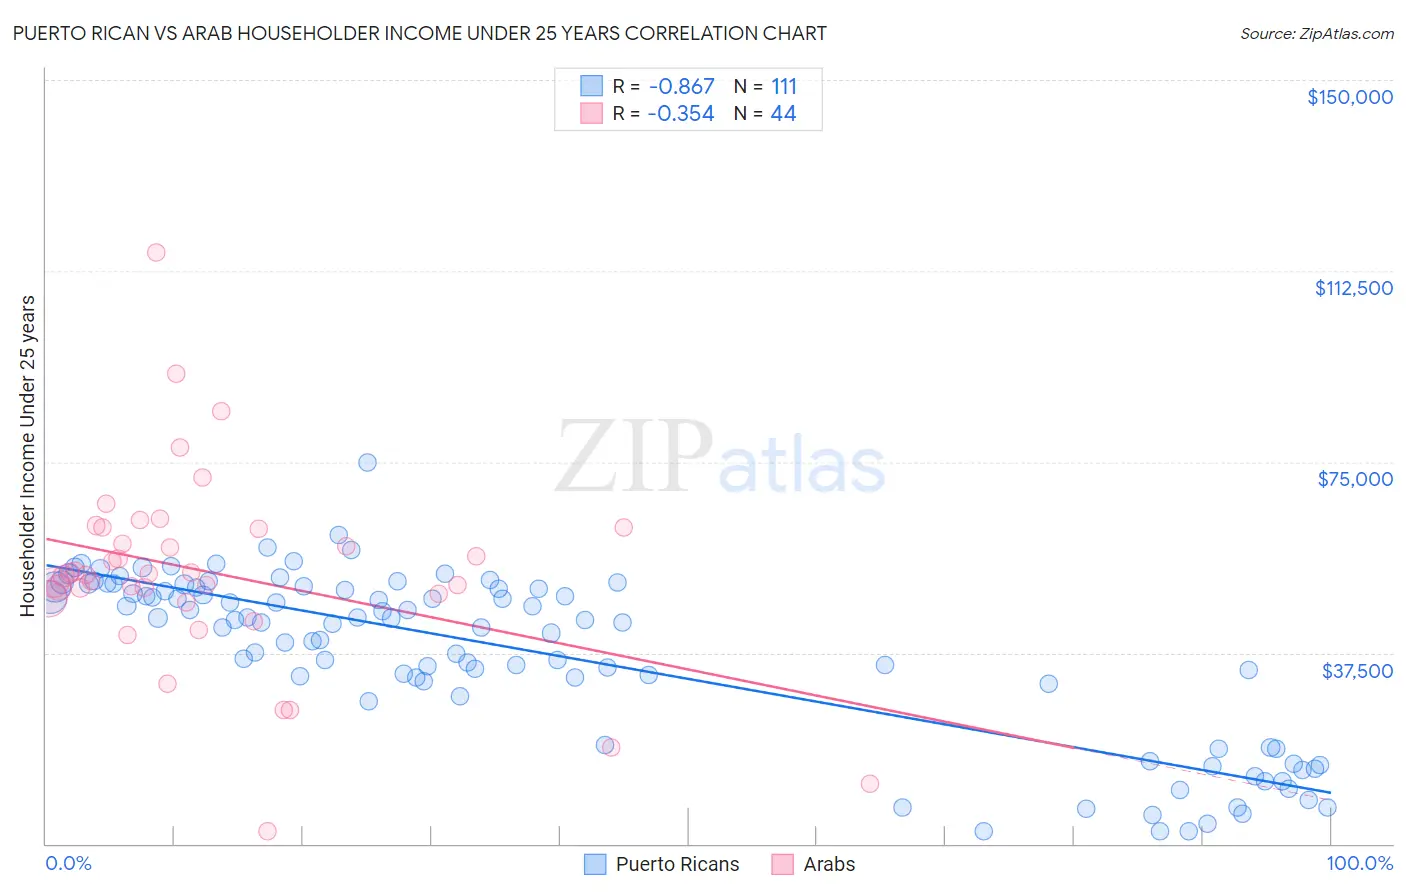
Puerto Rican vs Arab Householder Income Under 25 years Correlation Chart
The statistical analysis conducted on geographies consisting of 421,445,593 people shows a very strong negative correlation between the proportion of Puerto Ricans and household income with householder under the age of 25 in the United States with a correlation coefficient (R) of -0.867 and weighted average of $39,726. Similarly, the statistical analysis conducted on geographies consisting of 397,690,882 people shows a mild negative correlation between the proportion of Arabs and household income with householder under the age of 25 in the United States with a correlation coefficient (R) of -0.354 and weighted average of $51,219, a difference of 28.9%.
Householder Income Under 25 years Correlation Summary
| Measurement | Puerto Rican | Arab |
| Minimum | $2,499 | $2,499 |
| Maximum | $74,844 | $116,189 |
| Range | $72,345 | $113,690 |
| Mean | $37,468 | $53,228 |
| Median | $43,546 | $52,860 |
| Interquartile 25% (IQ1) | $28,872 | $48,642 |
| Interquartile 75% (IQ3) | $50,281 | $61,942 |
| Interquartile Range (IQR) | $21,410 | $13,300 |
| Standard Deviation (Sample) | $16,633 | $19,395 |
| Standard Deviation (Population) | $16,558 | $19,173 |
Similar Demographics by Householder Income Under 25 years
Demographics Similar to Puerto Ricans by Householder Income Under 25 years
In terms of householder income under 25 years, the demographic groups most similar to Puerto Ricans are Navajo ($42,380, a difference of 6.7%), Immigrants from Congo ($43,266, a difference of 8.9%), Immigrants from Yemen ($43,591, a difference of 9.7%), Arapaho ($44,003, a difference of 10.8%), and Houma ($44,356, a difference of 11.7%).
| Demographics | Rating | Rank | Householder Income Under 25 years |
| Creek | 0.0 /100 | #333 | Tragic $45,371 |
| Cajuns | 0.0 /100 | #334 | Tragic $45,338 |
| Cheyenne | 0.0 /100 | #335 | Tragic $45,275 |
| Tohono O'odham | 0.0 /100 | #336 | Tragic $45,248 |
| Pueblo | 0.0 /100 | #337 | Tragic $45,018 |
| Chickasaw | 0.0 /100 | #338 | Tragic $44,763 |
| Kiowa | 0.0 /100 | #339 | Tragic $44,733 |
| Blacks/African Americans | 0.0 /100 | #340 | Tragic $44,381 |
| Houma | 0.0 /100 | #341 | Tragic $44,356 |
| Arapaho | 0.0 /100 | #342 | Tragic $44,003 |
| Immigrants | Yemen | 0.0 /100 | #343 | Tragic $43,591 |
| Immigrants | Congo | 0.0 /100 | #344 | Tragic $43,266 |
| Navajo | 0.0 /100 | #345 | Tragic $42,380 |
| Puerto Ricans | 0.0 /100 | #346 | Tragic $39,726 |
| Lumbee | 0.0 /100 | #347 | Tragic $34,584 |
Demographics Similar to Arabs by Householder Income Under 25 years
In terms of householder income under 25 years, the demographic groups most similar to Arabs are Czechoslovakian ($51,224, a difference of 0.010%), Immigrants from Belize ($51,223, a difference of 0.010%), French ($51,230, a difference of 0.020%), Icelander ($51,247, a difference of 0.050%), and Immigrants from Germany ($51,190, a difference of 0.060%).
| Demographics | Rating | Rank | Householder Income Under 25 years |
| Immigrants | Panama | 9.7 /100 | #212 | Tragic $51,278 |
| Dutch | 9.4 /100 | #213 | Tragic $51,265 |
| Zimbabweans | 9.3 /100 | #214 | Tragic $51,259 |
| Icelanders | 9.1 /100 | #215 | Tragic $51,247 |
| French | 8.7 /100 | #216 | Tragic $51,230 |
| Czechoslovakians | 8.6 /100 | #217 | Tragic $51,224 |
| Immigrants | Belize | 8.6 /100 | #218 | Tragic $51,223 |
| Arabs | 8.5 /100 | #219 | Tragic $51,219 |
| Immigrants | Germany | 8.0 /100 | #220 | Tragic $51,190 |
| Immigrants | Eastern Africa | 7.4 /100 | #221 | Tragic $51,158 |
| Spaniards | 6.8 /100 | #222 | Tragic $51,117 |
| Serbians | 6.6 /100 | #223 | Tragic $51,106 |
| Belizeans | 6.4 /100 | #224 | Tragic $51,094 |
| Immigrants | Jamaica | 5.6 /100 | #225 | Tragic $51,038 |
| Yugoslavians | 5.5 /100 | #226 | Tragic $51,028 |