Hawaiian vs Immigrants from Nicaragua Median Female Earnings
COMPARE
Hawaiian
Immigrants from Nicaragua
Median Female Earnings
Median Female Earnings Comparison
Hawaiians
Immigrants from Nicaragua
$37,497
MEDIAN FEMALE EARNINGS
1.0/ 100
METRIC RATING
257th/ 347
METRIC RANK
$36,023
MEDIAN FEMALE EARNINGS
0.0/ 100
METRIC RATING
287th/ 347
METRIC RANK
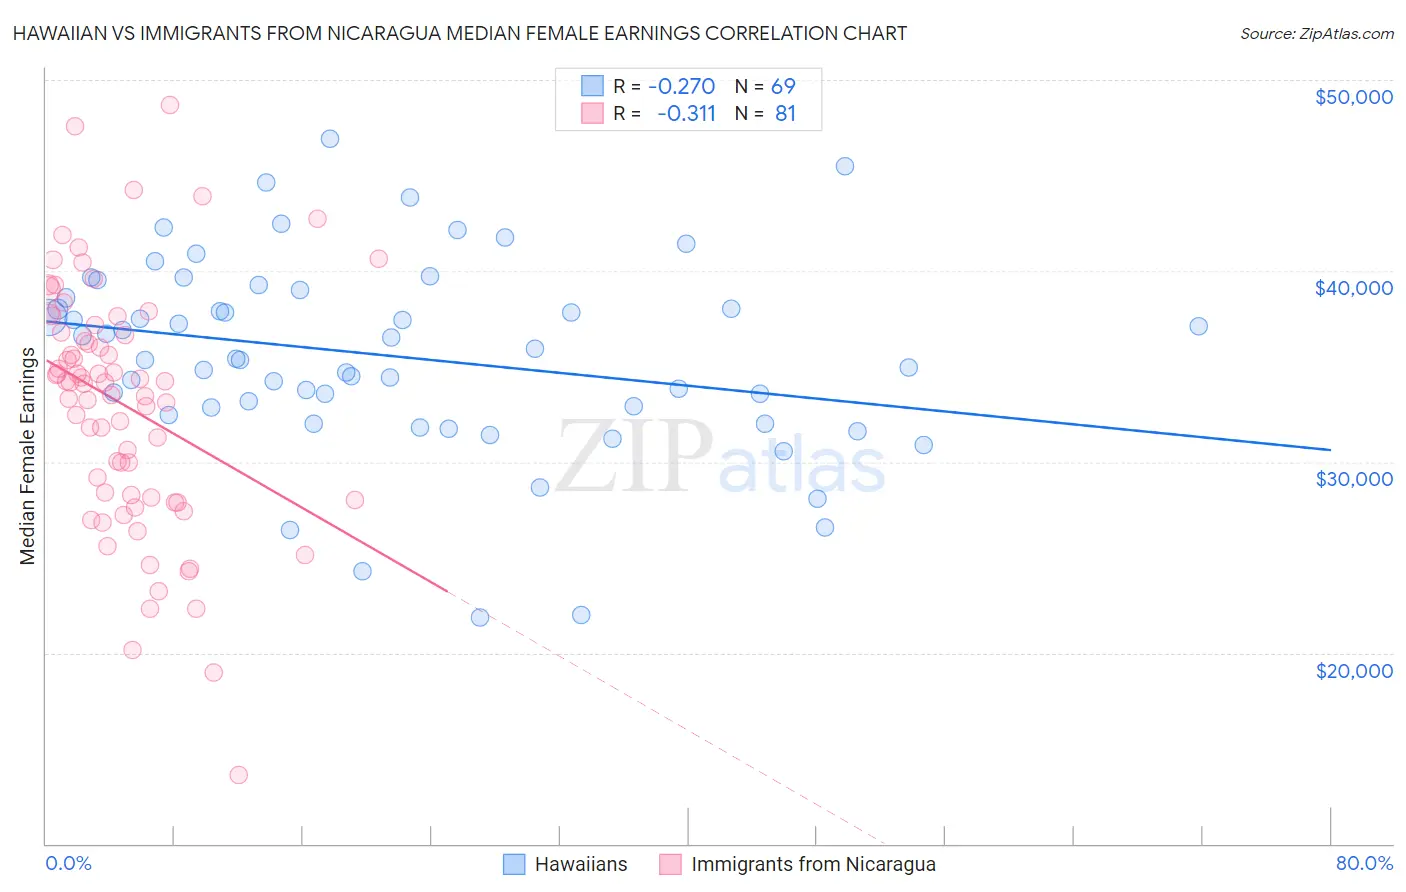
Hawaiian vs Immigrants from Nicaragua Median Female Earnings Correlation Chart
The statistical analysis conducted on geographies consisting of 327,459,895 people shows a weak negative correlation between the proportion of Hawaiians and median female earnings in the United States with a correlation coefficient (R) of -0.270 and weighted average of $37,497. Similarly, the statistical analysis conducted on geographies consisting of 236,298,559 people shows a mild negative correlation between the proportion of Immigrants from Nicaragua and median female earnings in the United States with a correlation coefficient (R) of -0.311 and weighted average of $36,023, a difference of 4.1%.
Median Female Earnings Correlation Summary
| Measurement | Hawaiian | Immigrants from Nicaragua |
| Minimum | $21,870 | $13,608 |
| Maximum | $46,893 | $48,676 |
| Range | $25,022 | $35,068 |
| Mean | $35,548 | $32,980 |
| Median | $35,373 | $34,129 |
| Interquartile 25% (IQ1) | $32,654 | $28,072 |
| Interquartile 75% (IQ3) | $38,788 | $36,975 |
| Interquartile Range (IQR) | $6,134 | $8,904 |
| Standard Deviation (Sample) | $5,103 | $6,452 |
| Standard Deviation (Population) | $5,066 | $6,412 |
Similar Demographics by Median Female Earnings
Demographics Similar to Hawaiians by Median Female Earnings
In terms of median female earnings, the demographic groups most similar to Hawaiians are Samoan ($37,498, a difference of 0.0%), Colville ($37,514, a difference of 0.040%), White/Caucasian ($37,531, a difference of 0.090%), Belizean ($37,429, a difference of 0.18%), and Scotch-Irish ($37,383, a difference of 0.31%).
| Demographics | Rating | Rank | Median Female Earnings |
| Immigrants | Iraq | 2.2 /100 | #250 | Tragic $37,864 |
| Welsh | 2.1 /100 | #251 | Tragic $37,856 |
| Immigrants | Dominica | 2.0 /100 | #252 | Tragic $37,825 |
| Danes | 1.6 /100 | #253 | Tragic $37,730 |
| Whites/Caucasians | 1.1 /100 | #254 | Tragic $37,531 |
| Colville | 1.1 /100 | #255 | Tragic $37,514 |
| Samoans | 1.0 /100 | #256 | Tragic $37,498 |
| Hawaiians | 1.0 /100 | #257 | Tragic $37,497 |
| Belizeans | 0.9 /100 | #258 | Tragic $37,429 |
| Scotch-Irish | 0.8 /100 | #259 | Tragic $37,383 |
| Dutch | 0.7 /100 | #260 | Tragic $37,339 |
| Malaysians | 0.7 /100 | #261 | Tragic $37,298 |
| Venezuelans | 0.7 /100 | #262 | Tragic $37,282 |
| German Russians | 0.5 /100 | #263 | Tragic $37,105 |
| Salvadorans | 0.4 /100 | #264 | Tragic $37,083 |
Demographics Similar to Immigrants from Nicaragua by Median Female Earnings
In terms of median female earnings, the demographic groups most similar to Immigrants from Nicaragua are Immigrants from Zaire ($36,017, a difference of 0.020%), Osage ($36,034, a difference of 0.030%), Paiute ($36,056, a difference of 0.090%), Bangladeshi ($35,960, a difference of 0.17%), and Central American Indian ($35,930, a difference of 0.26%).
| Demographics | Rating | Rank | Median Female Earnings |
| Iroquois | 0.1 /100 | #280 | Tragic $36,408 |
| Spanish Americans | 0.1 /100 | #281 | Tragic $36,391 |
| Haitians | 0.1 /100 | #282 | Tragic $36,374 |
| Immigrants | Haiti | 0.1 /100 | #283 | Tragic $36,203 |
| Indonesians | 0.1 /100 | #284 | Tragic $36,140 |
| Paiute | 0.1 /100 | #285 | Tragic $36,056 |
| Osage | 0.0 /100 | #286 | Tragic $36,034 |
| Immigrants | Nicaragua | 0.0 /100 | #287 | Tragic $36,023 |
| Immigrants | Zaire | 0.0 /100 | #288 | Tragic $36,017 |
| Bangladeshis | 0.0 /100 | #289 | Tragic $35,960 |
| Central American Indians | 0.0 /100 | #290 | Tragic $35,930 |
| Blackfeet | 0.0 /100 | #291 | Tragic $35,864 |
| Americans | 0.0 /100 | #292 | Tragic $35,777 |
| Guatemalans | 0.0 /100 | #293 | Tragic $35,695 |
| Cheyenne | 0.0 /100 | #294 | Tragic $35,673 |