Hawaiian vs Pima Median Female Earnings
COMPARE
Hawaiian
Pima
Median Female Earnings
Median Female Earnings Comparison
Hawaiians
Pima
$37,497
MEDIAN FEMALE EARNINGS
1.0/ 100
METRIC RATING
257th/ 347
METRIC RANK
$35,326
MEDIAN FEMALE EARNINGS
0.0/ 100
METRIC RATING
301st/ 347
METRIC RANK
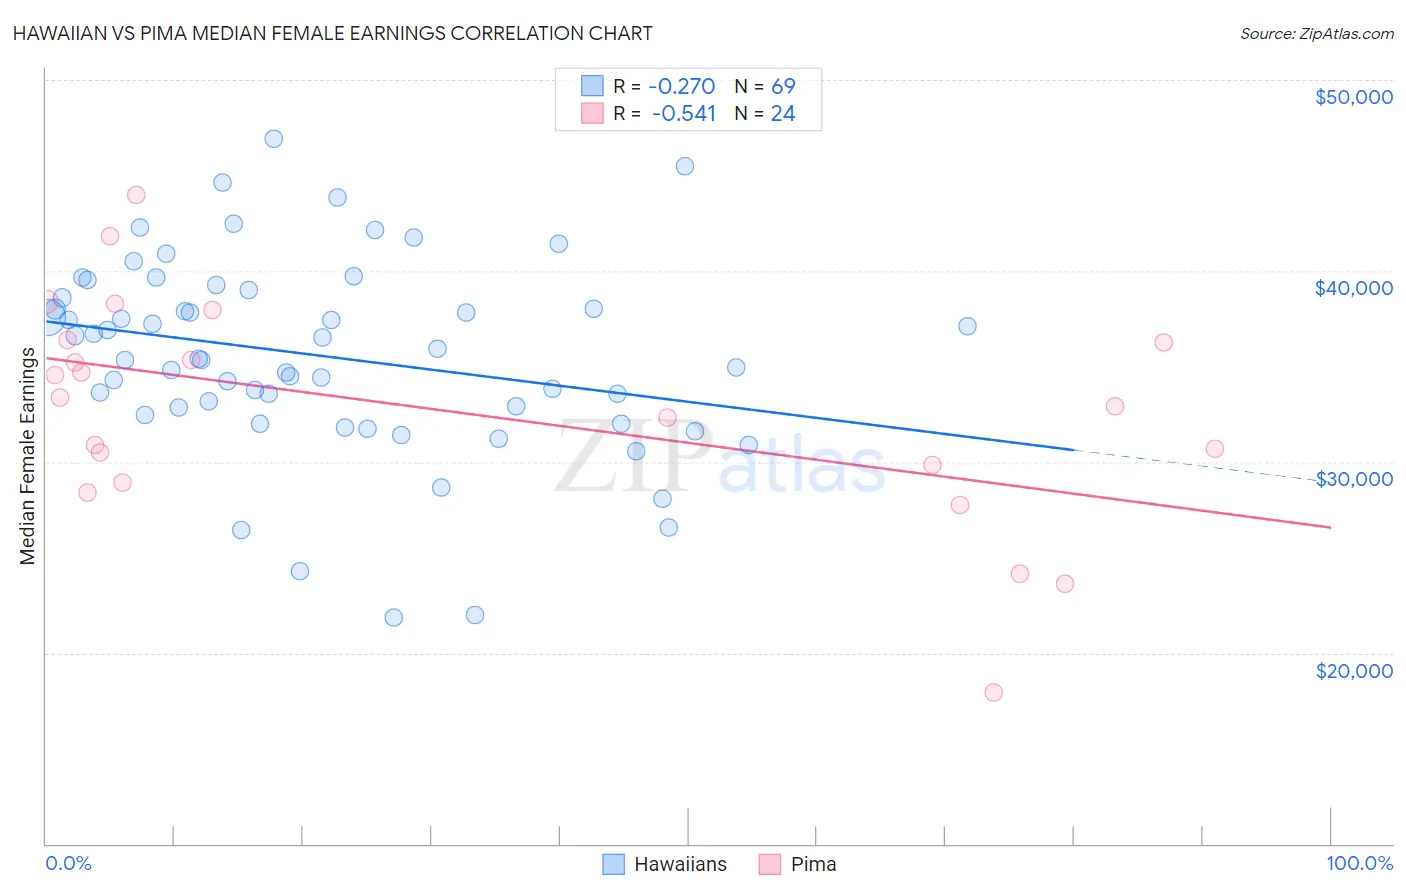
Hawaiian vs Pima Median Female Earnings Correlation Chart
The statistical analysis conducted on geographies consisting of 327,459,895 people shows a weak negative correlation between the proportion of Hawaiians and median female earnings in the United States with a correlation coefficient (R) of -0.270 and weighted average of $37,497. Similarly, the statistical analysis conducted on geographies consisting of 61,524,471 people shows a substantial negative correlation between the proportion of Pima and median female earnings in the United States with a correlation coefficient (R) of -0.541 and weighted average of $35,326, a difference of 6.1%.
Median Female Earnings Correlation Summary
| Measurement | Hawaiian | Pima |
| Minimum | $21,870 | $17,917 |
| Maximum | $46,893 | $43,952 |
| Range | $25,022 | $26,035 |
| Mean | $35,548 | $32,676 |
| Median | $35,373 | $33,171 |
| Interquartile 25% (IQ1) | $32,654 | $29,398 |
| Interquartile 75% (IQ3) | $38,788 | $36,333 |
| Interquartile Range (IQR) | $6,134 | $6,935 |
| Standard Deviation (Sample) | $5,103 | $5,900 |
| Standard Deviation (Population) | $5,066 | $5,776 |
Similar Demographics by Median Female Earnings
Demographics Similar to Hawaiians by Median Female Earnings
In terms of median female earnings, the demographic groups most similar to Hawaiians are Samoan ($37,498, a difference of 0.0%), Colville ($37,514, a difference of 0.040%), White/Caucasian ($37,531, a difference of 0.090%), Belizean ($37,429, a difference of 0.18%), and Scotch-Irish ($37,383, a difference of 0.31%).
| Demographics | Rating | Rank | Median Female Earnings |
| Immigrants | Iraq | 2.2 /100 | #250 | Tragic $37,864 |
| Welsh | 2.1 /100 | #251 | Tragic $37,856 |
| Immigrants | Dominica | 2.0 /100 | #252 | Tragic $37,825 |
| Danes | 1.6 /100 | #253 | Tragic $37,730 |
| Whites/Caucasians | 1.1 /100 | #254 | Tragic $37,531 |
| Colville | 1.1 /100 | #255 | Tragic $37,514 |
| Samoans | 1.0 /100 | #256 | Tragic $37,498 |
| Hawaiians | 1.0 /100 | #257 | Tragic $37,497 |
| Belizeans | 0.9 /100 | #258 | Tragic $37,429 |
| Scotch-Irish | 0.8 /100 | #259 | Tragic $37,383 |
| Dutch | 0.7 /100 | #260 | Tragic $37,339 |
| Malaysians | 0.7 /100 | #261 | Tragic $37,298 |
| Venezuelans | 0.7 /100 | #262 | Tragic $37,282 |
| German Russians | 0.5 /100 | #263 | Tragic $37,105 |
| Salvadorans | 0.4 /100 | #264 | Tragic $37,083 |
Demographics Similar to Pima by Median Female Earnings
In terms of median female earnings, the demographic groups most similar to Pima are Black/African American ($35,315, a difference of 0.030%), Immigrants from Latin America ($35,307, a difference of 0.050%), Yuman ($35,377, a difference of 0.14%), Crow ($35,266, a difference of 0.17%), and Immigrants from Guatemala ($35,444, a difference of 0.33%).
| Demographics | Rating | Rank | Median Female Earnings |
| Cheyenne | 0.0 /100 | #294 | Tragic $35,673 |
| Comanche | 0.0 /100 | #295 | Tragic $35,661 |
| Mexican American Indians | 0.0 /100 | #296 | Tragic $35,629 |
| Hmong | 0.0 /100 | #297 | Tragic $35,498 |
| Immigrants | Micronesia | 0.0 /100 | #298 | Tragic $35,477 |
| Immigrants | Guatemala | 0.0 /100 | #299 | Tragic $35,444 |
| Yuman | 0.0 /100 | #300 | Tragic $35,377 |
| Pima | 0.0 /100 | #301 | Tragic $35,326 |
| Blacks/African Americans | 0.0 /100 | #302 | Tragic $35,315 |
| Immigrants | Latin America | 0.0 /100 | #303 | Tragic $35,307 |
| Crow | 0.0 /100 | #304 | Tragic $35,266 |
| Bahamians | 0.0 /100 | #305 | Tragic $35,125 |
| Fijians | 0.0 /100 | #306 | Tragic $35,114 |
| Sioux | 0.0 /100 | #307 | Tragic $35,063 |
| Immigrants | Bahamas | 0.0 /100 | #308 | Tragic $35,027 |