Hawaiian vs Immigrants from Oceania Median Female Earnings
COMPARE
Hawaiian
Immigrants from Oceania
Median Female Earnings
Median Female Earnings Comparison
Hawaiians
Immigrants from Oceania
$37,497
MEDIAN FEMALE EARNINGS
1.0/ 100
METRIC RATING
257th/ 347
METRIC RANK
$40,297
MEDIAN FEMALE EARNINGS
77.6/ 100
METRIC RATING
154th/ 347
METRIC RANK
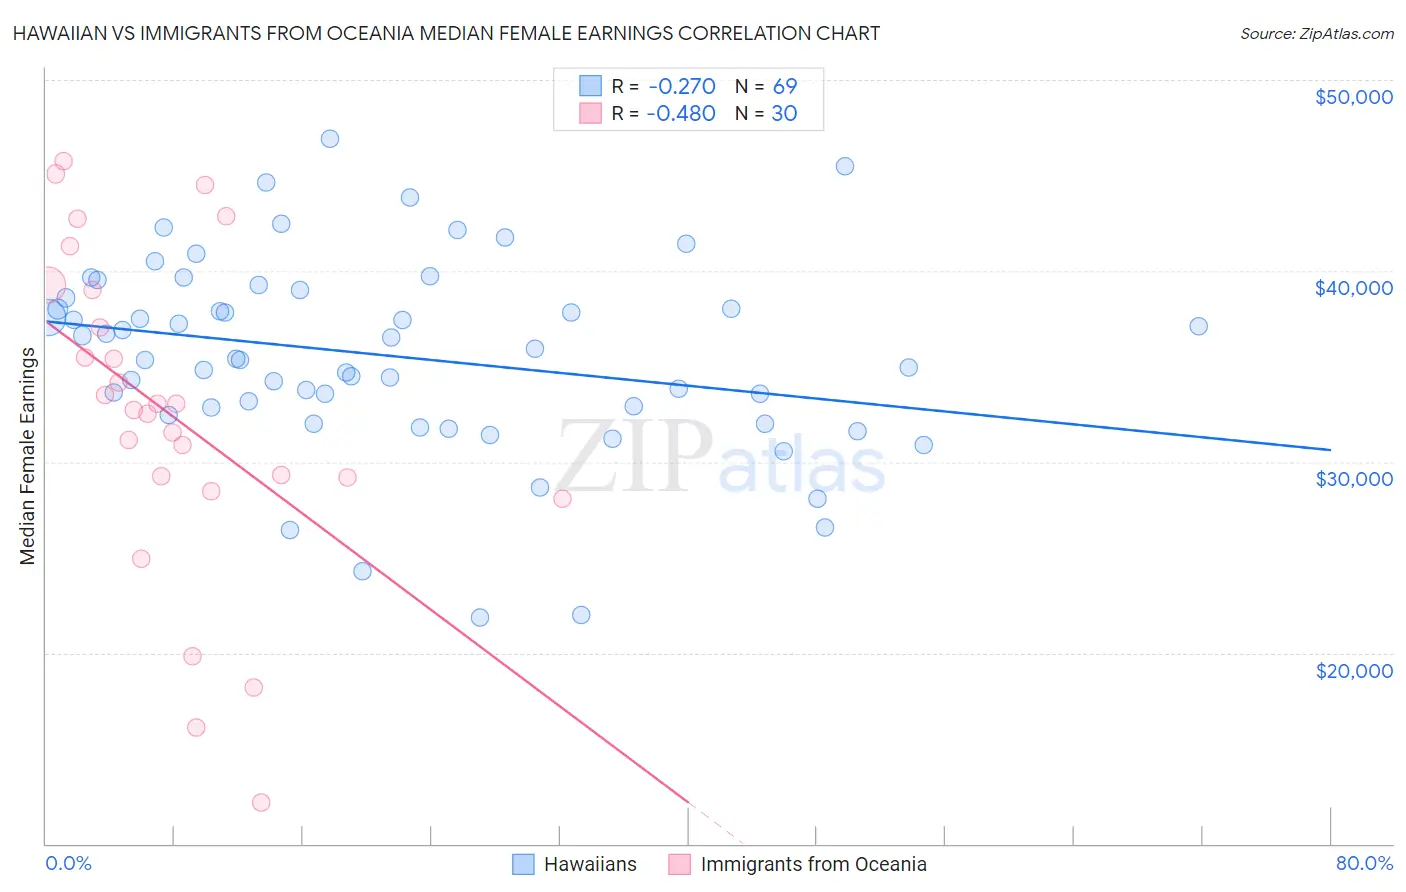
Hawaiian vs Immigrants from Oceania Median Female Earnings Correlation Chart
The statistical analysis conducted on geographies consisting of 327,459,895 people shows a weak negative correlation between the proportion of Hawaiians and median female earnings in the United States with a correlation coefficient (R) of -0.270 and weighted average of $37,497. Similarly, the statistical analysis conducted on geographies consisting of 305,406,455 people shows a moderate negative correlation between the proportion of Immigrants from Oceania and median female earnings in the United States with a correlation coefficient (R) of -0.480 and weighted average of $40,297, a difference of 7.5%.
Median Female Earnings Correlation Summary
| Measurement | Hawaiian | Immigrants from Oceania |
| Minimum | $21,870 | $12,128 |
| Maximum | $46,893 | $45,730 |
| Range | $25,022 | $33,602 |
| Mean | $35,548 | $32,539 |
| Median | $35,373 | $32,878 |
| Interquartile 25% (IQ1) | $32,654 | $29,179 |
| Interquartile 75% (IQ3) | $38,788 | $38,985 |
| Interquartile Range (IQR) | $6,134 | $9,806 |
| Standard Deviation (Sample) | $5,103 | $8,467 |
| Standard Deviation (Population) | $5,066 | $8,325 |
Similar Demographics by Median Female Earnings
Demographics Similar to Hawaiians by Median Female Earnings
In terms of median female earnings, the demographic groups most similar to Hawaiians are Samoan ($37,498, a difference of 0.0%), Colville ($37,514, a difference of 0.040%), White/Caucasian ($37,531, a difference of 0.090%), Belizean ($37,429, a difference of 0.18%), and Scotch-Irish ($37,383, a difference of 0.31%).
| Demographics | Rating | Rank | Median Female Earnings |
| Immigrants | Iraq | 2.2 /100 | #250 | Tragic $37,864 |
| Welsh | 2.1 /100 | #251 | Tragic $37,856 |
| Immigrants | Dominica | 2.0 /100 | #252 | Tragic $37,825 |
| Danes | 1.6 /100 | #253 | Tragic $37,730 |
| Whites/Caucasians | 1.1 /100 | #254 | Tragic $37,531 |
| Colville | 1.1 /100 | #255 | Tragic $37,514 |
| Samoans | 1.0 /100 | #256 | Tragic $37,498 |
| Hawaiians | 1.0 /100 | #257 | Tragic $37,497 |
| Belizeans | 0.9 /100 | #258 | Tragic $37,429 |
| Scotch-Irish | 0.8 /100 | #259 | Tragic $37,383 |
| Dutch | 0.7 /100 | #260 | Tragic $37,339 |
| Malaysians | 0.7 /100 | #261 | Tragic $37,298 |
| Venezuelans | 0.7 /100 | #262 | Tragic $37,282 |
| German Russians | 0.5 /100 | #263 | Tragic $37,105 |
| Salvadorans | 0.4 /100 | #264 | Tragic $37,083 |
Demographics Similar to Immigrants from Oceania by Median Female Earnings
In terms of median female earnings, the demographic groups most similar to Immigrants from Oceania are British West Indian ($40,299, a difference of 0.010%), West Indian ($40,317, a difference of 0.050%), Immigrants from Africa ($40,257, a difference of 0.10%), Immigrants from Armenia ($40,340, a difference of 0.11%), and Immigrants from Cameroon ($40,354, a difference of 0.14%).
| Demographics | Rating | Rank | Median Female Earnings |
| Vietnamese | 80.4 /100 | #147 | Excellent $40,377 |
| Poles | 80.2 /100 | #148 | Excellent $40,371 |
| Immigrants | Cameroon | 79.7 /100 | #149 | Good $40,354 |
| Immigrants | Chile | 79.6 /100 | #150 | Good $40,353 |
| Immigrants | Armenia | 79.2 /100 | #151 | Good $40,340 |
| West Indians | 78.4 /100 | #152 | Good $40,317 |
| British West Indians | 77.7 /100 | #153 | Good $40,299 |
| Immigrants | Oceania | 77.6 /100 | #154 | Good $40,297 |
| Immigrants | Africa | 76.2 /100 | #155 | Good $40,257 |
| Peruvians | 75.3 /100 | #156 | Good $40,234 |
| Portuguese | 73.0 /100 | #157 | Good $40,177 |
| Immigrants | Senegal | 72.2 /100 | #158 | Good $40,157 |
| Immigrants | Vietnam | 72.0 /100 | #159 | Good $40,153 |
| Inupiat | 68.9 /100 | #160 | Good $40,080 |
| Alsatians | 68.0 /100 | #161 | Good $40,060 |