Iranian vs Sudanese Per Capita Income
COMPARE
Iranian
Sudanese
Per Capita Income
Per Capita Income Comparison
Iranians
Sudanese
$58,786
PER CAPITA INCOME
100.0/ 100
METRIC RATING
2nd/ 347
METRIC RANK
$41,695
PER CAPITA INCOME
9.9/ 100
METRIC RATING
215th/ 347
METRIC RANK
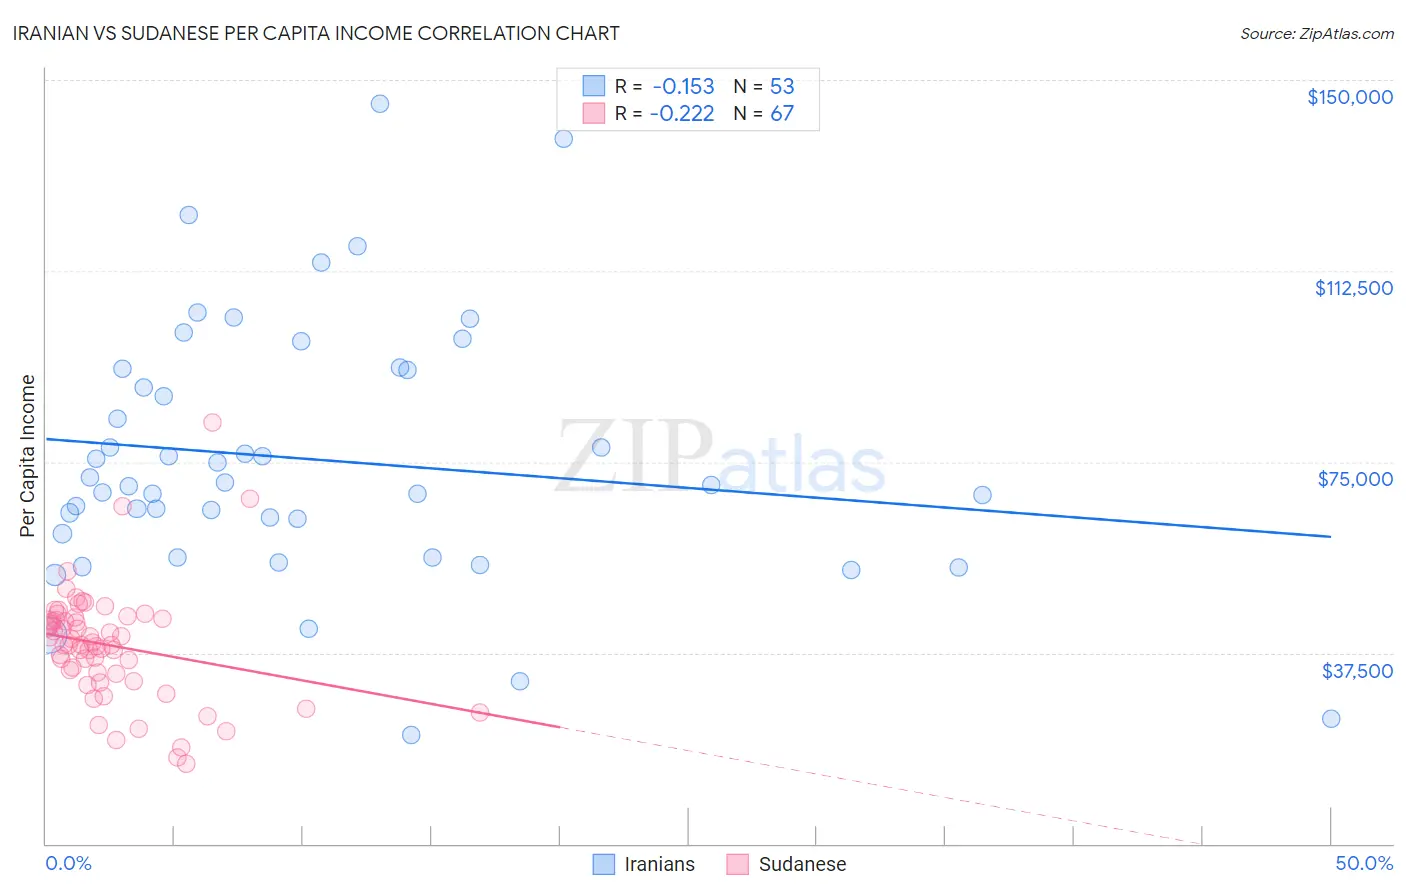
Iranian vs Sudanese Per Capita Income Correlation Chart
The statistical analysis conducted on geographies consisting of 316,916,136 people shows a poor negative correlation between the proportion of Iranians and per capita income in the United States with a correlation coefficient (R) of -0.153 and weighted average of $58,786. Similarly, the statistical analysis conducted on geographies consisting of 110,152,165 people shows a weak negative correlation between the proportion of Sudanese and per capita income in the United States with a correlation coefficient (R) of -0.222 and weighted average of $41,695, a difference of 41.0%.
Per Capita Income Correlation Summary
| Measurement | Iranian | Sudanese |
| Minimum | $21,346 | $15,628 |
| Maximum | $145,312 | $82,685 |
| Range | $123,966 | $67,057 |
| Mean | $75,439 | $38,981 |
| Median | $70,507 | $39,137 |
| Interquartile 25% (IQ1) | $58,523 | $33,494 |
| Interquartile 75% (IQ3) | $93,126 | $44,276 |
| Interquartile Range (IQR) | $34,604 | $10,782 |
| Standard Deviation (Sample) | $25,681 | $11,237 |
| Standard Deviation (Population) | $25,438 | $11,153 |
Similar Demographics by Per Capita Income
Demographics Similar to Iranians by Per Capita Income
In terms of per capita income, the demographic groups most similar to Iranians are Filipino ($59,066, a difference of 0.48%), Immigrants from Singapore ($58,353, a difference of 0.74%), Immigrants from Australia ($57,953, a difference of 1.4%), Immigrants from Iran ($57,759, a difference of 1.8%), and Immigrants from Taiwan ($57,742, a difference of 1.8%).
| Demographics | Rating | Rank | Per Capita Income |
| Filipinos | 100.0 /100 | #1 | Exceptional $59,066 |
| Iranians | 100.0 /100 | #2 | Exceptional $58,786 |
| Immigrants | Singapore | 100.0 /100 | #3 | Exceptional $58,353 |
| Immigrants | Australia | 100.0 /100 | #4 | Exceptional $57,953 |
| Immigrants | Iran | 100.0 /100 | #5 | Exceptional $57,759 |
| Immigrants | Taiwan | 100.0 /100 | #6 | Exceptional $57,742 |
| Immigrants | Israel | 100.0 /100 | #7 | Exceptional $57,384 |
| Immigrants | Hong Kong | 100.0 /100 | #8 | Exceptional $56,709 |
| Immigrants | Ireland | 100.0 /100 | #9 | Exceptional $56,584 |
| Okinawans | 100.0 /100 | #10 | Exceptional $55,817 |
| Eastern Europeans | 100.0 /100 | #11 | Exceptional $55,780 |
| Immigrants | Sweden | 100.0 /100 | #12 | Exceptional $55,582 |
| Immigrants | India | 100.0 /100 | #13 | Exceptional $55,268 |
| Immigrants | Belgium | 100.0 /100 | #14 | Exceptional $55,082 |
| Cypriots | 100.0 /100 | #15 | Exceptional $54,899 |
Demographics Similar to Sudanese by Per Capita Income
In terms of per capita income, the demographic groups most similar to Sudanese are Tongan ($41,693, a difference of 0.010%), Immigrants from Bangladesh ($41,709, a difference of 0.030%), Guamanian/Chamorro ($41,678, a difference of 0.040%), Immigrants from Venezuela ($41,727, a difference of 0.080%), and Trinidadian and Tobagonian ($41,655, a difference of 0.10%).
| Demographics | Rating | Rank | Per Capita Income |
| Panamanians | 13.9 /100 | #208 | Poor $42,035 |
| Immigrants | Sudan | 13.2 /100 | #209 | Poor $41,986 |
| Ecuadorians | 12.9 /100 | #210 | Poor $41,958 |
| Immigrants | Panama | 11.6 /100 | #211 | Poor $41,853 |
| Immigrants | Senegal | 11.3 /100 | #212 | Poor $41,830 |
| Immigrants | Venezuela | 10.2 /100 | #213 | Poor $41,727 |
| Immigrants | Bangladesh | 10.1 /100 | #214 | Poor $41,709 |
| Sudanese | 9.9 /100 | #215 | Tragic $41,695 |
| Tongans | 9.9 /100 | #216 | Tragic $41,693 |
| Guamanians/Chamorros | 9.7 /100 | #217 | Tragic $41,678 |
| Trinidadians and Tobagonians | 9.5 /100 | #218 | Tragic $41,655 |
| Puget Sound Salish | 8.1 /100 | #219 | Tragic $41,495 |
| Immigrants | Barbados | 7.9 /100 | #220 | Tragic $41,478 |
| Immigrants | Trinidad and Tobago | 7.9 /100 | #221 | Tragic $41,476 |
| Immigrants | Iraq | 7.1 /100 | #222 | Tragic $41,365 |