Egyptian vs Immigrants from Belarus Per Capita Income
COMPARE
Egyptian
Immigrants from Belarus
Per Capita Income
Per Capita Income Comparison
Egyptians
Immigrants from Belarus
$48,358
PER CAPITA INCOME
99.5/ 100
METRIC RATING
80th/ 347
METRIC RANK
$50,303
PER CAPITA INCOME
99.9/ 100
METRIC RATING
54th/ 347
METRIC RANK
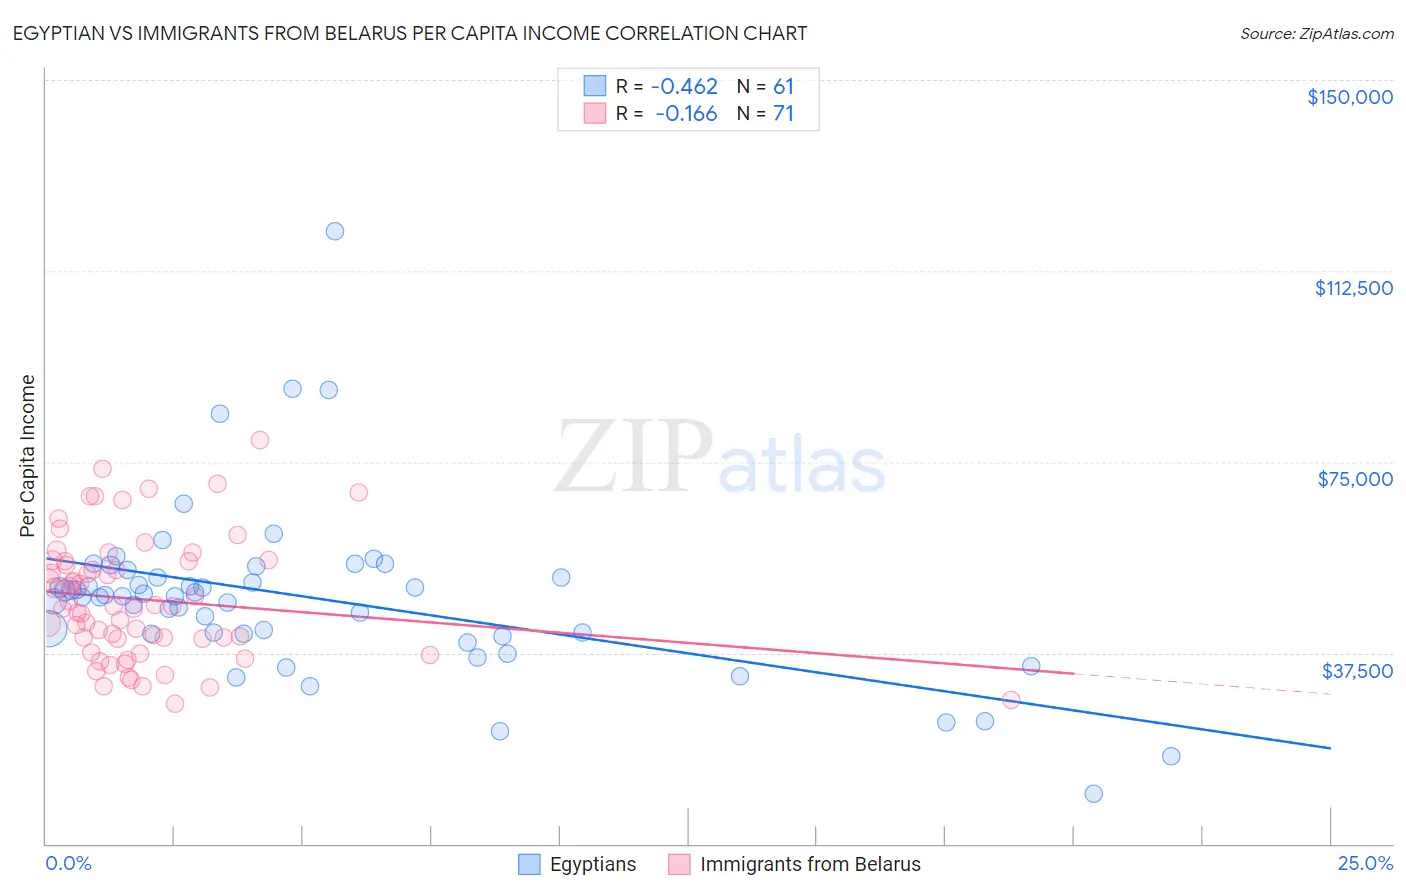
Egyptian vs Immigrants from Belarus Per Capita Income Correlation Chart
The statistical analysis conducted on geographies consisting of 276,936,692 people shows a moderate negative correlation between the proportion of Egyptians and per capita income in the United States with a correlation coefficient (R) of -0.462 and weighted average of $48,358. Similarly, the statistical analysis conducted on geographies consisting of 150,188,651 people shows a poor negative correlation between the proportion of Immigrants from Belarus and per capita income in the United States with a correlation coefficient (R) of -0.166 and weighted average of $50,303, a difference of 4.0%.
Per Capita Income Correlation Summary
| Measurement | Egyptian | Immigrants from Belarus |
| Minimum | $9,805 | $27,382 |
| Maximum | $120,225 | $79,346 |
| Range | $110,420 | $51,964 |
| Mean | $48,391 | $47,977 |
| Median | $48,690 | $46,691 |
| Interquartile 25% (IQ1) | $41,170 | $40,275 |
| Interquartile 75% (IQ3) | $53,076 | $55,569 |
| Interquartile Range (IQR) | $11,906 | $15,294 |
| Standard Deviation (Sample) | $16,881 | $11,980 |
| Standard Deviation (Population) | $16,742 | $11,895 |
Similar Demographics by Per Capita Income
Demographics Similar to Egyptians by Per Capita Income
In terms of per capita income, the demographic groups most similar to Egyptians are Armenian ($48,287, a difference of 0.15%), Romanian ($48,445, a difference of 0.18%), Immigrants from Indonesia ($48,195, a difference of 0.34%), Immigrants from Brazil ($48,164, a difference of 0.40%), and Immigrants from Ukraine ($48,134, a difference of 0.46%).
| Demographics | Rating | Rank | Per Capita Income |
| Immigrants | North America | 99.8 /100 | #73 | Exceptional $49,302 |
| Mongolians | 99.8 /100 | #74 | Exceptional $49,173 |
| Immigrants | Bolivia | 99.7 /100 | #75 | Exceptional $48,970 |
| Immigrants | England | 99.7 /100 | #76 | Exceptional $48,844 |
| Immigrants | Kazakhstan | 99.7 /100 | #77 | Exceptional $48,747 |
| Immigrants | Italy | 99.6 /100 | #78 | Exceptional $48,654 |
| Romanians | 99.5 /100 | #79 | Exceptional $48,445 |
| Egyptians | 99.5 /100 | #80 | Exceptional $48,358 |
| Armenians | 99.4 /100 | #81 | Exceptional $48,287 |
| Immigrants | Indonesia | 99.4 /100 | #82 | Exceptional $48,195 |
| Immigrants | Brazil | 99.4 /100 | #83 | Exceptional $48,164 |
| Immigrants | Ukraine | 99.3 /100 | #84 | Exceptional $48,134 |
| Austrians | 99.3 /100 | #85 | Exceptional $48,116 |
| Immigrants | Southern Europe | 99.3 /100 | #86 | Exceptional $48,027 |
| Ukrainians | 99.3 /100 | #87 | Exceptional $48,014 |
Demographics Similar to Immigrants from Belarus by Per Capita Income
In terms of per capita income, the demographic groups most similar to Immigrants from Belarus are Paraguayan ($50,385, a difference of 0.16%), Immigrants from Croatia ($50,417, a difference of 0.23%), Immigrants from Netherlands ($50,458, a difference of 0.31%), Immigrants from Western Europe ($50,065, a difference of 0.48%), and Asian ($50,057, a difference of 0.49%).
| Demographics | Rating | Rank | Per Capita Income |
| Bulgarians | 100.0 /100 | #47 | Exceptional $50,906 |
| Immigrants | Serbia | 100.0 /100 | #48 | Exceptional $50,810 |
| New Zealanders | 100.0 /100 | #49 | Exceptional $50,575 |
| Immigrants | Sri Lanka | 100.0 /100 | #50 | Exceptional $50,555 |
| Immigrants | Netherlands | 100.0 /100 | #51 | Exceptional $50,458 |
| Immigrants | Croatia | 99.9 /100 | #52 | Exceptional $50,417 |
| Paraguayans | 99.9 /100 | #53 | Exceptional $50,385 |
| Immigrants | Belarus | 99.9 /100 | #54 | Exceptional $50,303 |
| Immigrants | Western Europe | 99.9 /100 | #55 | Exceptional $50,065 |
| Asians | 99.9 /100 | #56 | Exceptional $50,057 |
| South Africans | 99.9 /100 | #57 | Exceptional $50,044 |
| Immigrants | Malaysia | 99.9 /100 | #58 | Exceptional $49,983 |
| Bhutanese | 99.9 /100 | #59 | Exceptional $49,894 |
| Immigrants | Scotland | 99.9 /100 | #60 | Exceptional $49,893 |
| Argentineans | 99.9 /100 | #61 | Exceptional $49,862 |