Pima vs Cheyenne Per Capita Income
COMPARE
Pima
Cheyenne
Per Capita Income
Per Capita Income Comparison
Pima
Cheyenne
$30,644
PER CAPITA INCOME
0.0/ 100
METRIC RATING
343rd/ 347
METRIC RANK
$35,276
PER CAPITA INCOME
0.0/ 100
METRIC RATING
323rd/ 347
METRIC RANK
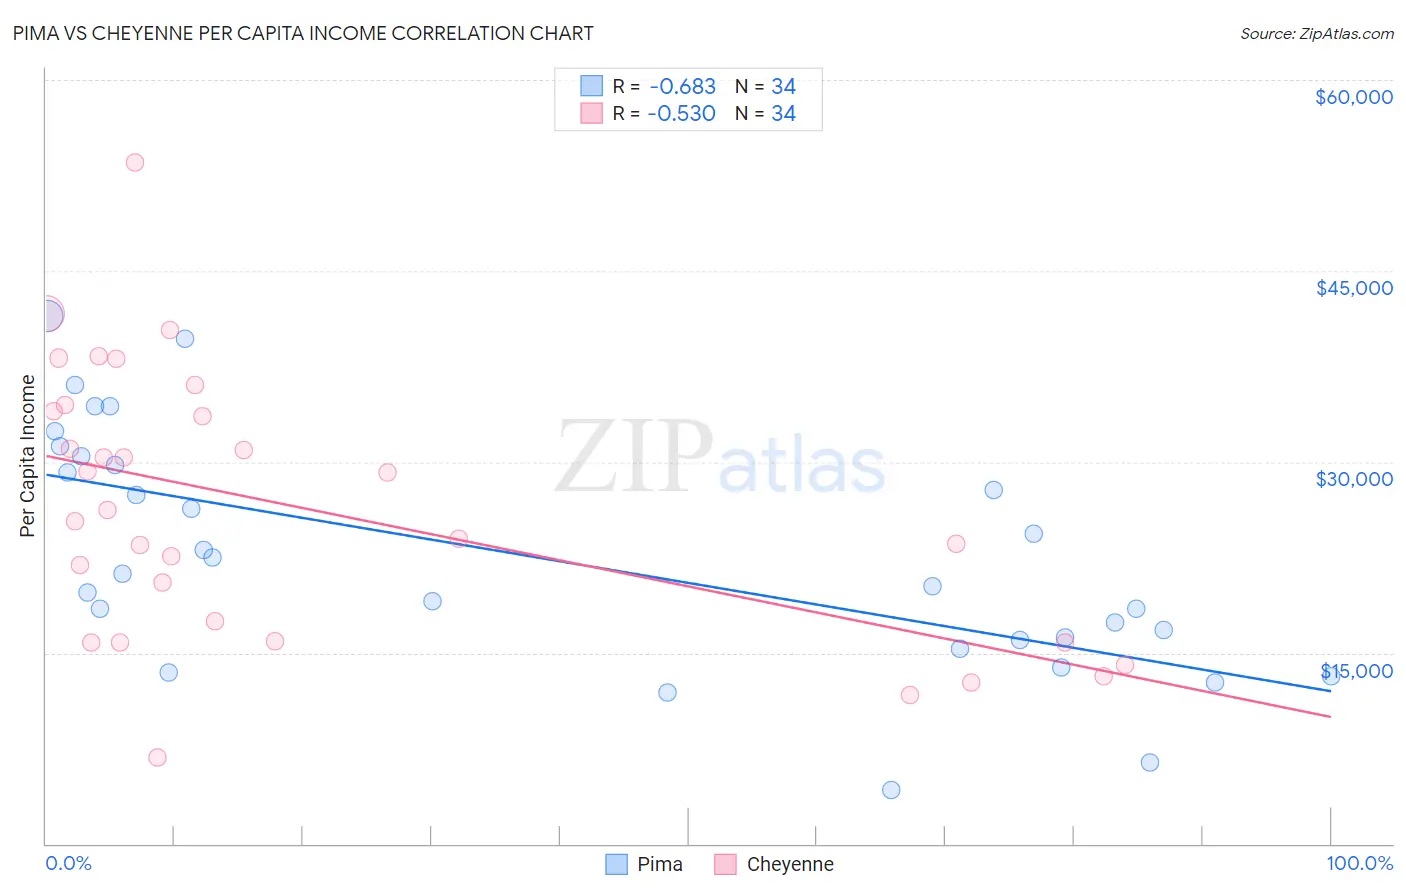
Pima vs Cheyenne Per Capita Income Correlation Chart
The statistical analysis conducted on geographies consisting of 61,552,682 people shows a significant negative correlation between the proportion of Pima and per capita income in the United States with a correlation coefficient (R) of -0.683 and weighted average of $30,644. Similarly, the statistical analysis conducted on geographies consisting of 80,722,590 people shows a substantial negative correlation between the proportion of Cheyenne and per capita income in the United States with a correlation coefficient (R) of -0.530 and weighted average of $35,276, a difference of 15.1%.
Per Capita Income Correlation Summary
| Measurement | Pima | Cheyenne |
| Minimum | $4,256 | $6,772 |
| Maximum | $41,474 | $53,471 |
| Range | $37,218 | $46,699 |
| Mean | $22,491 | $26,352 |
| Median | $20,723 | $25,776 |
| Interquartile 25% (IQ1) | $16,036 | $15,918 |
| Interquartile 75% (IQ3) | $29,725 | $33,955 |
| Interquartile Range (IQR) | $13,689 | $18,037 |
| Standard Deviation (Sample) | $9,246 | $10,544 |
| Standard Deviation (Population) | $9,109 | $10,388 |
Demographics Similar to Pima and Cheyenne by Per Capita Income
In terms of per capita income, the demographic groups most similar to Pima are Hopi ($31,177, a difference of 1.7%), Puerto Rican ($31,268, a difference of 2.0%), Crow ($31,729, a difference of 3.5%), Pueblo ($32,012, a difference of 4.5%), and Arapaho ($32,345, a difference of 5.6%). Similarly, the demographic groups most similar to Cheyenne are Kiowa ($35,102, a difference of 0.50%), Immigrants from Central America ($34,974, a difference of 0.87%), Immigrants from Cuba ($34,910, a difference of 1.1%), Apache ($34,886, a difference of 1.1%), and Menominee ($34,578, a difference of 2.0%).
| Demographics | Rating | Rank | Per Capita Income |
| Cheyenne | 0.0 /100 | #323 | Tragic $35,276 |
| Kiowa | 0.0 /100 | #324 | Tragic $35,102 |
| Immigrants | Central America | 0.0 /100 | #325 | Tragic $34,974 |
| Immigrants | Cuba | 0.0 /100 | #326 | Tragic $34,910 |
| Apache | 0.0 /100 | #327 | Tragic $34,886 |
| Menominee | 0.0 /100 | #328 | Tragic $34,578 |
| Mexicans | 0.0 /100 | #329 | Tragic $34,559 |
| Spanish American Indians | 0.0 /100 | #330 | Tragic $34,195 |
| Immigrants | Mexico | 0.0 /100 | #331 | Tragic $33,931 |
| Sioux | 0.0 /100 | #332 | Tragic $33,921 |
| Immigrants | Yemen | 0.0 /100 | #333 | Tragic $33,696 |
| Natives/Alaskans | 0.0 /100 | #334 | Tragic $33,279 |
| Yuman | 0.0 /100 | #335 | Tragic $33,236 |
| Yakama | 0.0 /100 | #336 | Tragic $33,009 |
| Houma | 0.0 /100 | #337 | Tragic $32,996 |
| Arapaho | 0.0 /100 | #338 | Tragic $32,345 |
| Pueblo | 0.0 /100 | #339 | Tragic $32,012 |
| Crow | 0.0 /100 | #340 | Tragic $31,729 |
| Puerto Ricans | 0.0 /100 | #341 | Tragic $31,268 |
| Hopi | 0.0 /100 | #342 | Tragic $31,177 |
| Pima | 0.0 /100 | #343 | Tragic $30,644 |