Ethiopian vs Ugandan Median Male Earnings
COMPARE
Ethiopian
Ugandan
Median Male Earnings
Median Male Earnings Comparison
Ethiopians
Ugandans
$56,243
MEDIAN MALE EARNINGS
84.8/ 100
METRIC RATING
142nd/ 347
METRIC RANK
$55,290
MEDIAN MALE EARNINGS
68.6/ 100
METRIC RATING
163rd/ 347
METRIC RANK
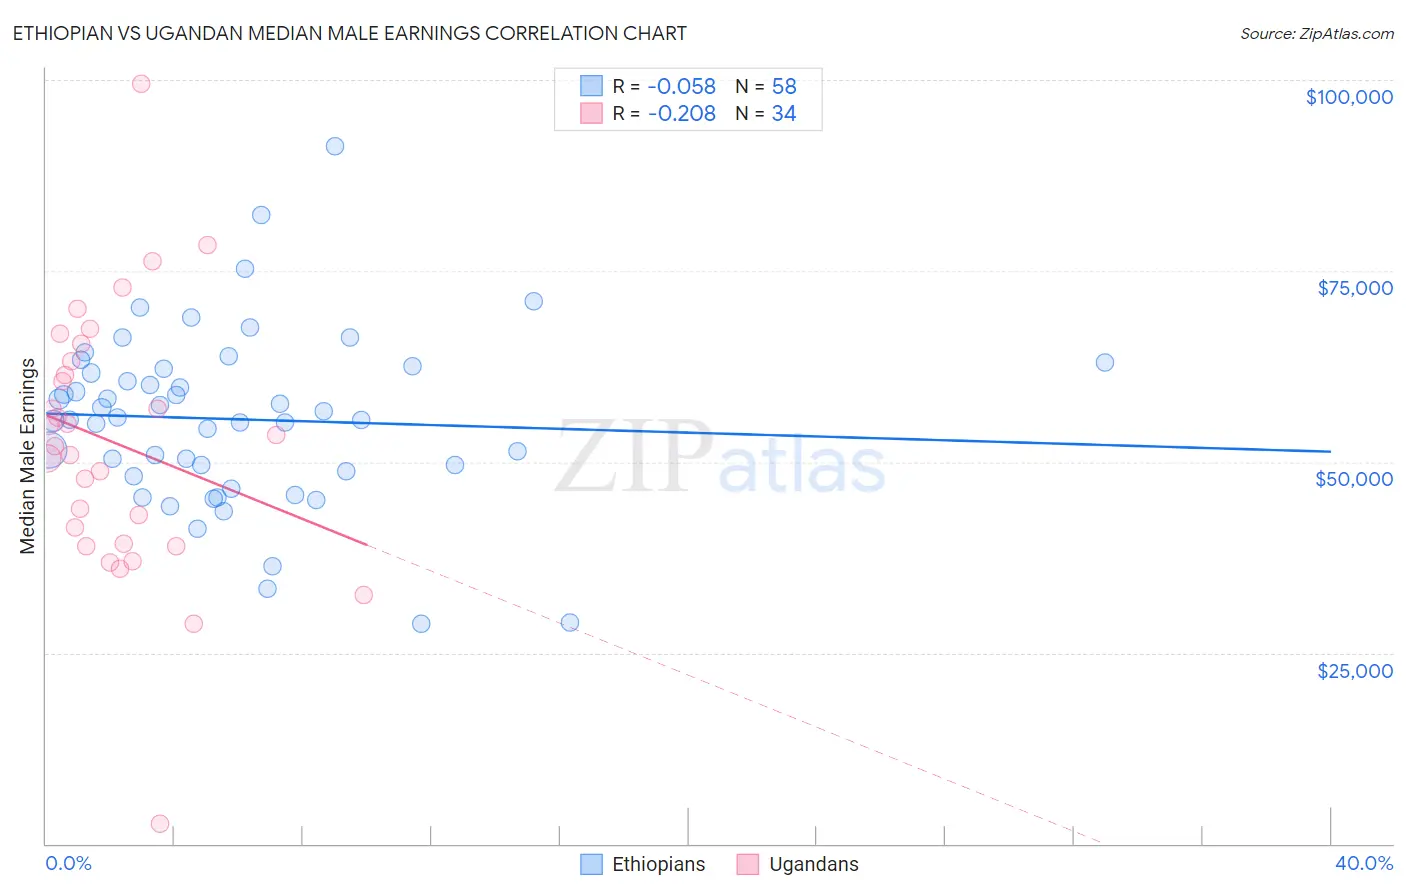
Ethiopian vs Ugandan Median Male Earnings Correlation Chart
The statistical analysis conducted on geographies consisting of 223,246,505 people shows a slight negative correlation between the proportion of Ethiopians and median male earnings in the United States with a correlation coefficient (R) of -0.058 and weighted average of $56,243. Similarly, the statistical analysis conducted on geographies consisting of 94,009,031 people shows a weak negative correlation between the proportion of Ugandans and median male earnings in the United States with a correlation coefficient (R) of -0.208 and weighted average of $55,290, a difference of 1.7%.
Median Male Earnings Correlation Summary
| Measurement | Ethiopian | Ugandan |
| Minimum | $28,882 | $2,614 |
| Maximum | $91,333 | $99,574 |
| Range | $62,451 | $96,960 |
| Mean | $55,598 | $52,480 |
| Median | $55,634 | $52,840 |
| Interquartile 25% (IQ1) | $48,793 | $39,217 |
| Interquartile 75% (IQ3) | $62,132 | $63,193 |
| Interquartile Range (IQR) | $13,339 | $23,975 |
| Standard Deviation (Sample) | $11,505 | $17,547 |
| Standard Deviation (Population) | $11,405 | $17,287 |
Similar Demographics by Median Male Earnings
Demographics Similar to Ethiopians by Median Male Earnings
In terms of median male earnings, the demographic groups most similar to Ethiopians are Danish ($56,246, a difference of 0.0%), Zimbabwean ($56,302, a difference of 0.10%), Luxembourger ($56,300, a difference of 0.10%), Slovak ($56,306, a difference of 0.11%), and Sri Lankan ($56,136, a difference of 0.19%).
| Demographics | Rating | Rank | Median Male Earnings |
| Irish | 87.4 /100 | #135 | Excellent $56,464 |
| Immigrants | Saudi Arabia | 87.2 /100 | #136 | Excellent $56,452 |
| Slavs | 86.5 /100 | #137 | Excellent $56,390 |
| Slovaks | 85.5 /100 | #138 | Excellent $56,306 |
| Zimbabweans | 85.5 /100 | #139 | Excellent $56,302 |
| Luxembourgers | 85.5 /100 | #140 | Excellent $56,300 |
| Danes | 84.8 /100 | #141 | Excellent $56,246 |
| Ethiopians | 84.8 /100 | #142 | Excellent $56,243 |
| Sri Lankans | 83.4 /100 | #143 | Excellent $56,136 |
| Immigrants | Uganda | 82.4 /100 | #144 | Excellent $56,064 |
| Norwegians | 80.9 /100 | #145 | Excellent $55,965 |
| Immigrants | Chile | 80.7 /100 | #146 | Excellent $55,954 |
| Immigrants | Philippines | 78.4 /100 | #147 | Good $55,809 |
| Scottish | 78.2 /100 | #148 | Good $55,793 |
| English | 77.4 /100 | #149 | Good $55,747 |
Demographics Similar to Ugandans by Median Male Earnings
In terms of median male earnings, the demographic groups most similar to Ugandans are Immigrants from South Eastern Asia ($55,241, a difference of 0.090%), French ($55,350, a difference of 0.11%), Belgian ($55,361, a difference of 0.13%), Basque ($55,370, a difference of 0.15%), and Alsatian ($55,380, a difference of 0.16%).
| Demographics | Rating | Rank | Median Male Earnings |
| Immigrants | Ethiopia | 71.6 /100 | #156 | Good $55,434 |
| Icelanders | 71.2 /100 | #157 | Good $55,415 |
| Czechoslovakians | 70.5 /100 | #158 | Good $55,382 |
| Alsatians | 70.5 /100 | #159 | Good $55,380 |
| Basques | 70.3 /100 | #160 | Good $55,370 |
| Belgians | 70.1 /100 | #161 | Good $55,361 |
| French | 69.9 /100 | #162 | Good $55,350 |
| Ugandans | 68.6 /100 | #163 | Good $55,290 |
| Immigrants | South Eastern Asia | 67.6 /100 | #164 | Good $55,241 |
| Immigrants | Portugal | 66.3 /100 | #165 | Good $55,182 |
| Germans | 61.6 /100 | #166 | Good $54,974 |
| Immigrants | Fiji | 61.2 /100 | #167 | Good $54,958 |
| Immigrants | Vietnam | 60.2 /100 | #168 | Good $54,913 |
| French Canadians | 55.6 /100 | #169 | Average $54,722 |
| Finns | 55.6 /100 | #170 | Average $54,721 |