Moroccan vs Trinidadian and Tobagonian Median Male Earnings
COMPARE
Moroccan
Trinidadian and Tobagonian
Median Male Earnings
Median Male Earnings Comparison
Moroccans
Trinidadians and Tobagonians
$56,499
MEDIAN MALE EARNINGS
87.7/ 100
METRIC RATING
134th/ 347
METRIC RANK
$51,446
MEDIAN MALE EARNINGS
4.8/ 100
METRIC RATING
227th/ 347
METRIC RANK
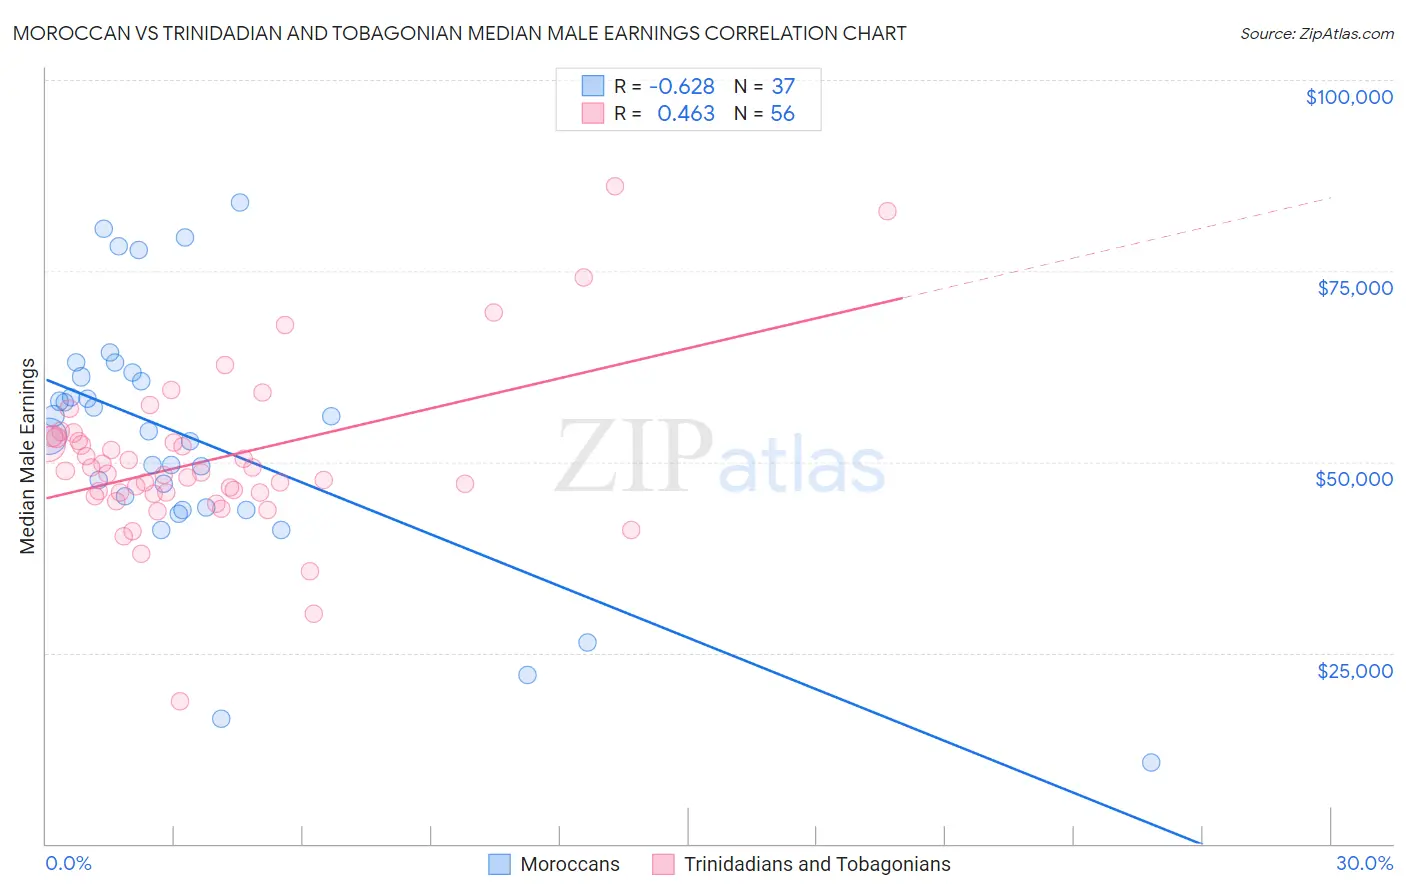
Moroccan vs Trinidadian and Tobagonian Median Male Earnings Correlation Chart
The statistical analysis conducted on geographies consisting of 201,785,575 people shows a significant negative correlation between the proportion of Moroccans and median male earnings in the United States with a correlation coefficient (R) of -0.628 and weighted average of $56,499. Similarly, the statistical analysis conducted on geographies consisting of 219,852,286 people shows a moderate positive correlation between the proportion of Trinidadians and Tobagonians and median male earnings in the United States with a correlation coefficient (R) of 0.463 and weighted average of $51,446, a difference of 9.8%.
Median Male Earnings Correlation Summary
| Measurement | Moroccan | Trinidadian and Tobagonian |
| Minimum | $10,662 | $18,666 |
| Maximum | $84,023 | $86,046 |
| Range | $73,361 | $67,380 |
| Mean | $52,885 | $50,279 |
| Median | $54,008 | $48,562 |
| Interquartile 25% (IQ1) | $43,924 | $45,885 |
| Interquartile 75% (IQ3) | $61,434 | $52,942 |
| Interquartile Range (IQR) | $17,511 | $7,058 |
| Standard Deviation (Sample) | $16,590 | $10,888 |
| Standard Deviation (Population) | $16,364 | $10,790 |
Similar Demographics by Median Male Earnings
Demographics Similar to Moroccans by Median Male Earnings
In terms of median male earnings, the demographic groups most similar to Moroccans are Irish ($56,464, a difference of 0.060%), Czech ($56,546, a difference of 0.080%), Immigrants from Germany ($56,542, a difference of 0.080%), Immigrants from Saudi Arabia ($56,452, a difference of 0.080%), and Slavic ($56,390, a difference of 0.19%).
| Demographics | Rating | Rank | Median Male Earnings |
| Brazilians | 90.9 /100 | #127 | Exceptional $56,837 |
| Immigrants | Syria | 90.8 /100 | #128 | Exceptional $56,830 |
| Pakistanis | 89.9 /100 | #129 | Excellent $56,719 |
| Koreans | 89.4 /100 | #130 | Excellent $56,672 |
| Portuguese | 89.4 /100 | #131 | Excellent $56,663 |
| Czechs | 88.2 /100 | #132 | Excellent $56,546 |
| Immigrants | Germany | 88.2 /100 | #133 | Excellent $56,542 |
| Moroccans | 87.7 /100 | #134 | Excellent $56,499 |
| Irish | 87.4 /100 | #135 | Excellent $56,464 |
| Immigrants | Saudi Arabia | 87.2 /100 | #136 | Excellent $56,452 |
| Slavs | 86.5 /100 | #137 | Excellent $56,390 |
| Slovaks | 85.5 /100 | #138 | Excellent $56,306 |
| Zimbabweans | 85.5 /100 | #139 | Excellent $56,302 |
| Luxembourgers | 85.5 /100 | #140 | Excellent $56,300 |
| Danes | 84.8 /100 | #141 | Excellent $56,246 |
Demographics Similar to Trinidadians and Tobagonians by Median Male Earnings
In terms of median male earnings, the demographic groups most similar to Trinidadians and Tobagonians are Japanese ($51,473, a difference of 0.050%), Immigrants from Sudan ($51,489, a difference of 0.080%), Samoan ($51,389, a difference of 0.11%), Immigrants from Trinidad and Tobago ($51,376, a difference of 0.14%), and Immigrants from Nigeria ($51,310, a difference of 0.27%).
| Demographics | Rating | Rank | Median Male Earnings |
| Immigrants | Armenia | 6.6 /100 | #220 | Tragic $51,793 |
| Immigrants | Senegal | 5.8 /100 | #221 | Tragic $51,647 |
| Immigrants | Bangladesh | 5.8 /100 | #222 | Tragic $51,642 |
| Ecuadorians | 5.5 /100 | #223 | Tragic $51,596 |
| Immigrants | Cambodia | 5.5 /100 | #224 | Tragic $51,594 |
| Immigrants | Sudan | 5.0 /100 | #225 | Tragic $51,489 |
| Japanese | 4.9 /100 | #226 | Tragic $51,473 |
| Trinidadians and Tobagonians | 4.8 /100 | #227 | Tragic $51,446 |
| Samoans | 4.6 /100 | #228 | Tragic $51,389 |
| Immigrants | Trinidad and Tobago | 4.5 /100 | #229 | Tragic $51,376 |
| Immigrants | Nigeria | 4.2 /100 | #230 | Tragic $51,310 |
| Barbadians | 3.9 /100 | #231 | Tragic $51,236 |
| Sudanese | 3.9 /100 | #232 | Tragic $51,216 |
| Aleuts | 3.7 /100 | #233 | Tragic $51,168 |
| Cape Verdeans | 3.5 /100 | #234 | Tragic $51,103 |