Polish vs Immigrants from Kazakhstan Median Male Earnings
COMPARE
Polish
Immigrants from Kazakhstan
Median Male Earnings
Median Male Earnings Comparison
Poles
Immigrants from Kazakhstan
$58,139
MEDIAN MALE EARNINGS
97.3/ 100
METRIC RATING
103rd/ 347
METRIC RANK
$59,278
MEDIAN MALE EARNINGS
99.1/ 100
METRIC RATING
92nd/ 347
METRIC RANK
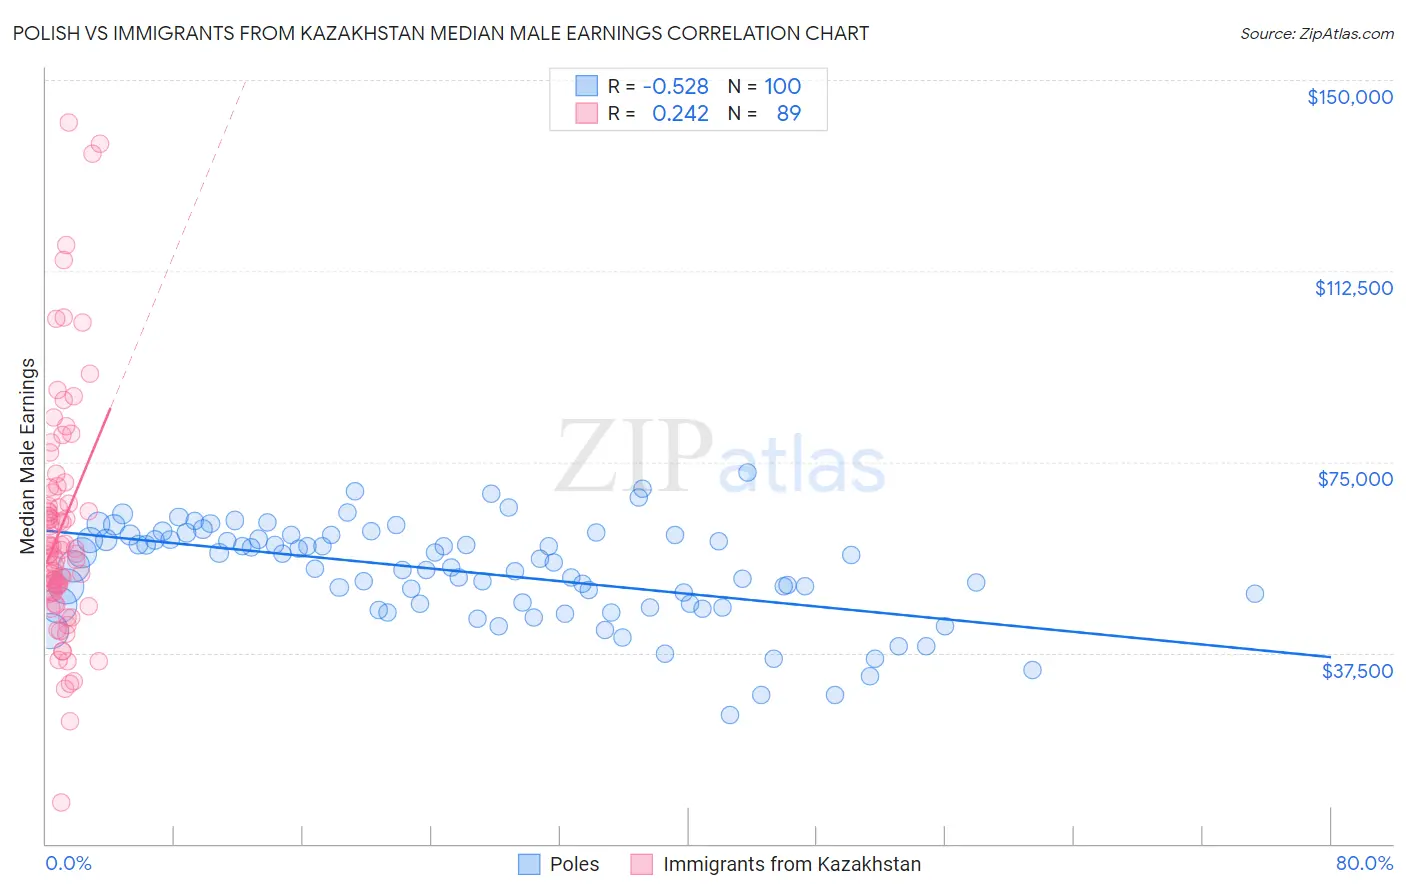
Polish vs Immigrants from Kazakhstan Median Male Earnings Correlation Chart
The statistical analysis conducted on geographies consisting of 559,585,611 people shows a substantial negative correlation between the proportion of Poles and median male earnings in the United States with a correlation coefficient (R) of -0.528 and weighted average of $58,139. Similarly, the statistical analysis conducted on geographies consisting of 124,430,044 people shows a weak positive correlation between the proportion of Immigrants from Kazakhstan and median male earnings in the United States with a correlation coefficient (R) of 0.242 and weighted average of $59,278, a difference of 2.0%.
Median Male Earnings Correlation Summary
| Measurement | Polish | Immigrants from Kazakhstan |
| Minimum | $25,204 | $8,214 |
| Maximum | $72,933 | $141,534 |
| Range | $47,729 | $133,320 |
| Mean | $53,382 | $62,279 |
| Median | $54,879 | $57,775 |
| Interquartile 25% (IQ1) | $46,953 | $49,614 |
| Interquartile 75% (IQ3) | $60,187 | $69,378 |
| Interquartile Range (IQR) | $13,234 | $19,764 |
| Standard Deviation (Sample) | $9,652 | $23,727 |
| Standard Deviation (Population) | $9,604 | $23,593 |
Demographics Similar to Poles and Immigrants from Kazakhstan by Median Male Earnings
In terms of median male earnings, the demographic groups most similar to Poles are Armenian ($58,134, a difference of 0.010%), Immigrants from Western Asia ($58,131, a difference of 0.020%), Syrian ($58,187, a difference of 0.080%), Immigrants from Northern Africa ($58,008, a difference of 0.23%), and Serbian ($57,975, a difference of 0.28%). Similarly, the demographic groups most similar to Immigrants from Kazakhstan are Immigrants from Southern Europe ($59,217, a difference of 0.10%), Laotian ($59,351, a difference of 0.12%), Austrian ($59,359, a difference of 0.14%), Immigrants from North Macedonia ($59,189, a difference of 0.15%), and Immigrants from Moldova ($59,417, a difference of 0.24%).
| Demographics | Rating | Rank | Median Male Earnings |
| Macedonians | 99.3 /100 | #87 | Exceptional $59,522 |
| Immigrants | Argentina | 99.3 /100 | #88 | Exceptional $59,491 |
| Immigrants | Moldova | 99.2 /100 | #89 | Exceptional $59,417 |
| Austrians | 99.2 /100 | #90 | Exceptional $59,359 |
| Laotians | 99.2 /100 | #91 | Exceptional $59,351 |
| Immigrants | Kazakhstan | 99.1 /100 | #92 | Exceptional $59,278 |
| Immigrants | Southern Europe | 99.0 /100 | #93 | Exceptional $59,217 |
| Immigrants | North Macedonia | 99.0 /100 | #94 | Exceptional $59,189 |
| Immigrants | Lebanon | 98.6 /100 | #95 | Exceptional $58,835 |
| Albanians | 98.4 /100 | #96 | Exceptional $58,680 |
| Northern Europeans | 98.2 /100 | #97 | Exceptional $58,588 |
| Jordanians | 98.1 /100 | #98 | Exceptional $58,500 |
| Immigrants | Poland | 98.0 /100 | #99 | Exceptional $58,452 |
| Assyrians/Chaldeans/Syriacs | 97.9 /100 | #100 | Exceptional $58,437 |
| Immigrants | Brazil | 97.7 /100 | #101 | Exceptional $58,324 |
| Syrians | 97.4 /100 | #102 | Exceptional $58,187 |
| Poles | 97.3 /100 | #103 | Exceptional $58,139 |
| Armenians | 97.3 /100 | #104 | Exceptional $58,134 |
| Immigrants | Western Asia | 97.3 /100 | #105 | Exceptional $58,131 |
| Immigrants | Northern Africa | 96.9 /100 | #106 | Exceptional $58,008 |
| Serbians | 96.8 /100 | #107 | Exceptional $57,975 |