Portuguese vs Immigrants from Belgium Median Male Earnings
COMPARE
Portuguese
Immigrants from Belgium
Median Male Earnings
Median Male Earnings Comparison
Portuguese
Immigrants from Belgium
$56,663
MEDIAN MALE EARNINGS
89.4/ 100
METRIC RATING
131st/ 347
METRIC RANK
$66,125
MEDIAN MALE EARNINGS
100.0/ 100
METRIC RATING
17th/ 347
METRIC RANK
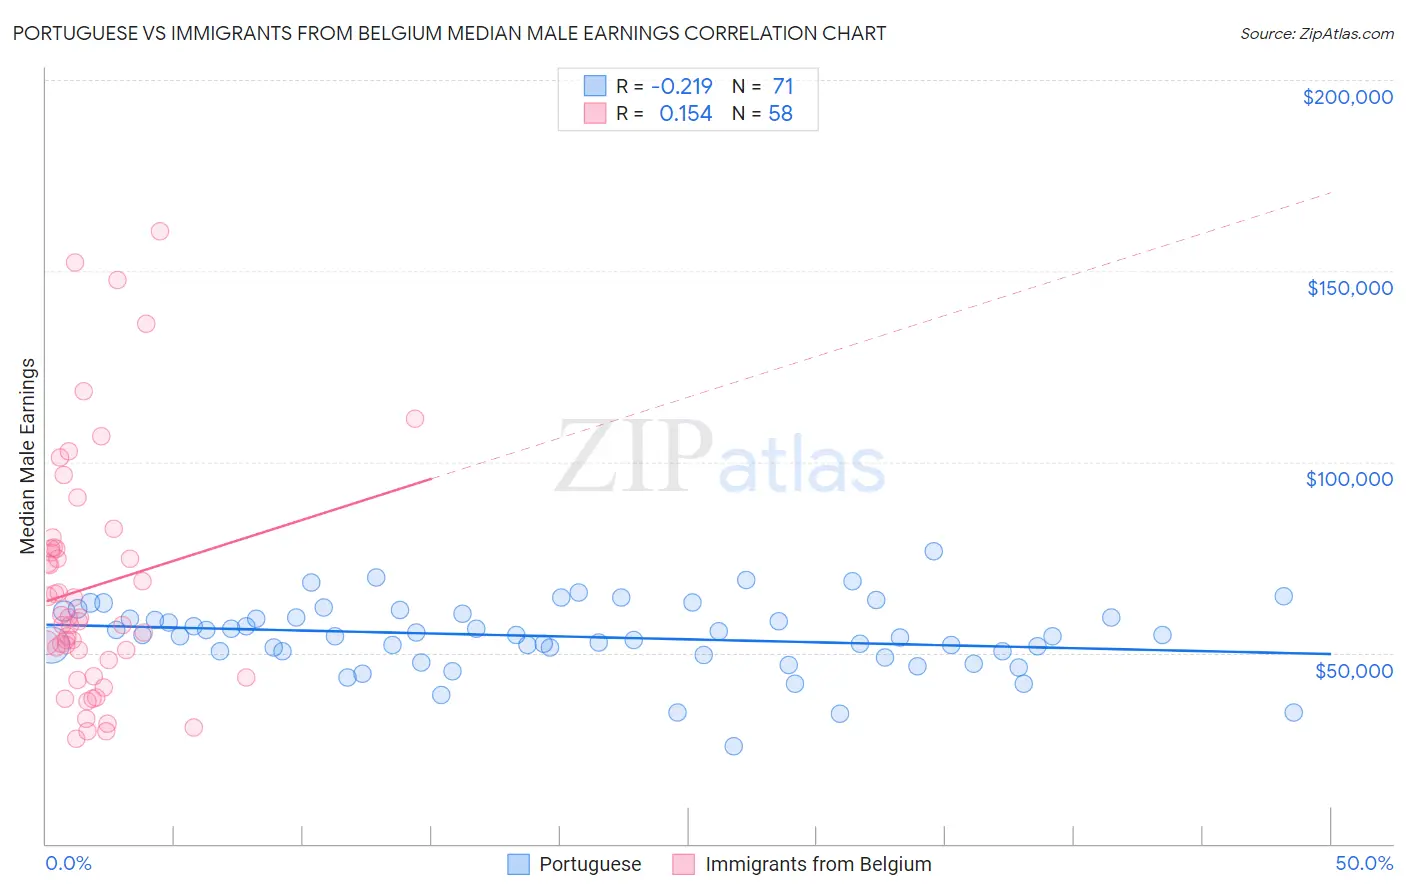
Portuguese vs Immigrants from Belgium Median Male Earnings Correlation Chart
The statistical analysis conducted on geographies consisting of 450,078,327 people shows a weak negative correlation between the proportion of Portuguese and median male earnings in the United States with a correlation coefficient (R) of -0.219 and weighted average of $56,663. Similarly, the statistical analysis conducted on geographies consisting of 146,683,317 people shows a poor positive correlation between the proportion of Immigrants from Belgium and median male earnings in the United States with a correlation coefficient (R) of 0.154 and weighted average of $66,125, a difference of 16.7%.
Median Male Earnings Correlation Summary
| Measurement | Portuguese | Immigrants from Belgium |
| Minimum | $25,598 | $27,540 |
| Maximum | $76,528 | $160,536 |
| Range | $50,930 | $132,996 |
| Mean | $54,293 | $67,352 |
| Median | $54,519 | $58,812 |
| Interquartile 25% (IQ1) | $50,262 | $48,036 |
| Interquartile 75% (IQ3) | $60,181 | $77,202 |
| Interquartile Range (IQR) | $9,919 | $29,166 |
| Standard Deviation (Sample) | $9,132 | $31,129 |
| Standard Deviation (Population) | $9,067 | $30,859 |
Similar Demographics by Median Male Earnings
Demographics Similar to Portuguese by Median Male Earnings
In terms of median male earnings, the demographic groups most similar to Portuguese are Korean ($56,672, a difference of 0.020%), Pakistani ($56,719, a difference of 0.10%), Czech ($56,546, a difference of 0.21%), Immigrants from Germany ($56,542, a difference of 0.21%), and Immigrants from Syria ($56,830, a difference of 0.29%).
| Demographics | Rating | Rank | Median Male Earnings |
| Chileans | 91.9 /100 | #124 | Exceptional $56,973 |
| Immigrants | Morocco | 91.8 /100 | #125 | Exceptional $56,958 |
| Chinese | 91.1 /100 | #126 | Exceptional $56,872 |
| Brazilians | 90.9 /100 | #127 | Exceptional $56,837 |
| Immigrants | Syria | 90.8 /100 | #128 | Exceptional $56,830 |
| Pakistanis | 89.9 /100 | #129 | Excellent $56,719 |
| Koreans | 89.4 /100 | #130 | Excellent $56,672 |
| Portuguese | 89.4 /100 | #131 | Excellent $56,663 |
| Czechs | 88.2 /100 | #132 | Excellent $56,546 |
| Immigrants | Germany | 88.2 /100 | #133 | Excellent $56,542 |
| Moroccans | 87.7 /100 | #134 | Excellent $56,499 |
| Irish | 87.4 /100 | #135 | Excellent $56,464 |
| Immigrants | Saudi Arabia | 87.2 /100 | #136 | Excellent $56,452 |
| Slavs | 86.5 /100 | #137 | Excellent $56,390 |
| Slovaks | 85.5 /100 | #138 | Excellent $56,306 |
Demographics Similar to Immigrants from Belgium by Median Male Earnings
In terms of median male earnings, the demographic groups most similar to Immigrants from Belgium are Indian (Asian) ($66,078, a difference of 0.070%), Eastern European ($66,472, a difference of 0.53%), Cypriot ($65,549, a difference of 0.88%), Immigrants from Japan ($65,518, a difference of 0.93%), and Immigrants from Sweden ($65,406, a difference of 1.1%).
| Demographics | Rating | Rank | Median Male Earnings |
| Immigrants | Israel | 100.0 /100 | #10 | Exceptional $68,716 |
| Immigrants | Ireland | 100.0 /100 | #11 | Exceptional $67,698 |
| Immigrants | Australia | 100.0 /100 | #12 | Exceptional $67,634 |
| Immigrants | China | 100.0 /100 | #13 | Exceptional $67,353 |
| Okinawans | 100.0 /100 | #14 | Exceptional $67,232 |
| Immigrants | Eastern Asia | 100.0 /100 | #15 | Exceptional $66,903 |
| Eastern Europeans | 100.0 /100 | #16 | Exceptional $66,472 |
| Immigrants | Belgium | 100.0 /100 | #17 | Exceptional $66,125 |
| Indians (Asian) | 100.0 /100 | #18 | Exceptional $66,078 |
| Cypriots | 100.0 /100 | #19 | Exceptional $65,549 |
| Immigrants | Japan | 100.0 /100 | #20 | Exceptional $65,518 |
| Immigrants | Sweden | 100.0 /100 | #21 | Exceptional $65,406 |
| Burmese | 100.0 /100 | #22 | Exceptional $65,236 |
| Immigrants | Korea | 100.0 /100 | #23 | Exceptional $65,079 |
| Immigrants | Northern Europe | 100.0 /100 | #24 | Exceptional $64,987 |