Cuban vs Immigrants from Dominican Republic Median Male Earnings
COMPARE
Cuban
Immigrants from Dominican Republic
Median Male Earnings
Median Male Earnings Comparison
Cubans
Immigrants from Dominican Republic
$46,580
MEDIAN MALE EARNINGS
0.0/ 100
METRIC RATING
310th/ 347
METRIC RANK
$46,655
MEDIAN MALE EARNINGS
0.0/ 100
METRIC RATING
307th/ 347
METRIC RANK
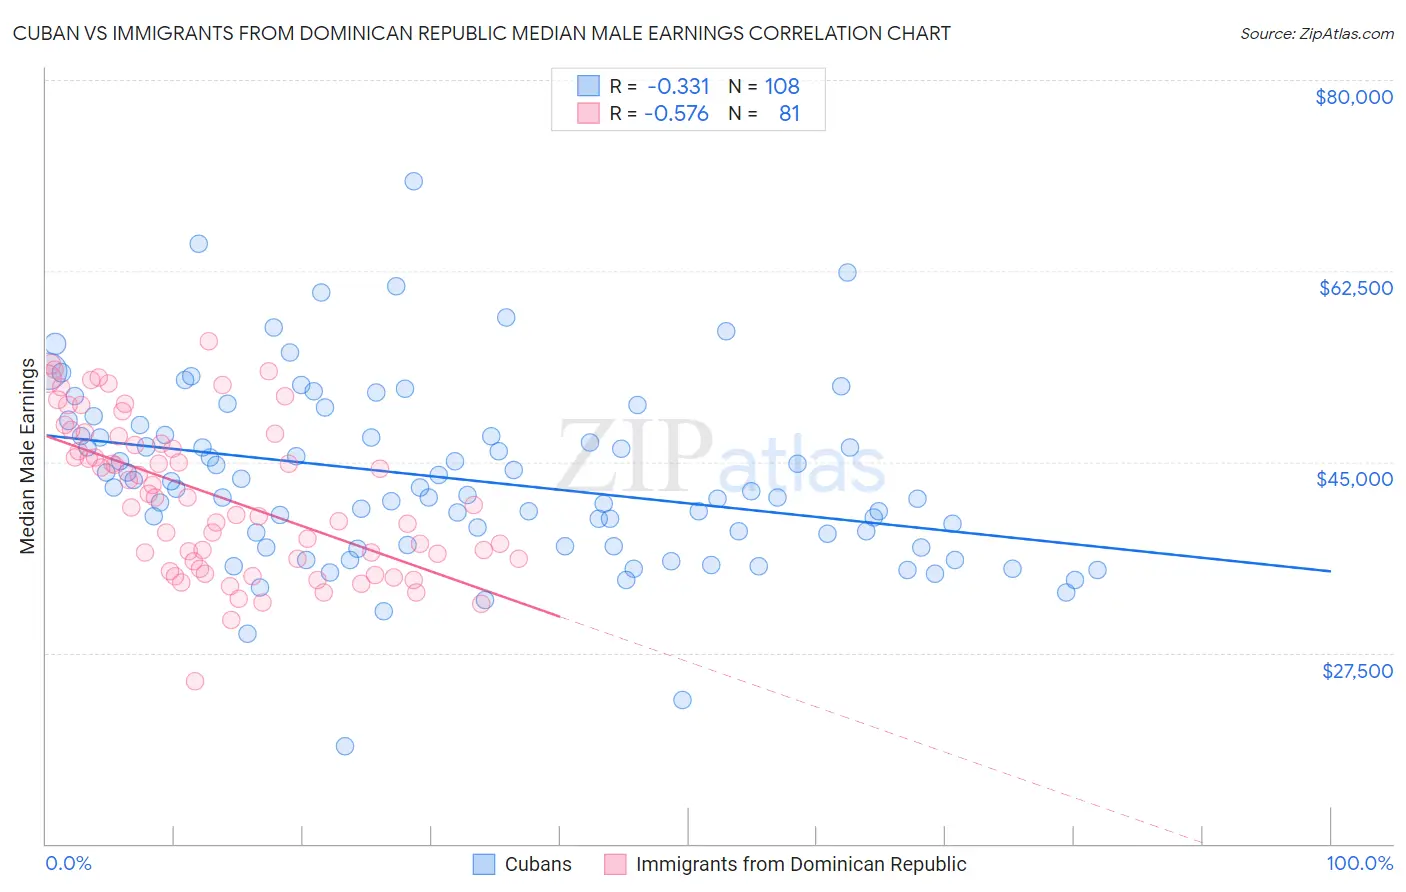
Cuban vs Immigrants from Dominican Republic Median Male Earnings Correlation Chart
The statistical analysis conducted on geographies consisting of 449,183,844 people shows a mild negative correlation between the proportion of Cubans and median male earnings in the United States with a correlation coefficient (R) of -0.331 and weighted average of $46,580. Similarly, the statistical analysis conducted on geographies consisting of 274,998,271 people shows a substantial negative correlation between the proportion of Immigrants from Dominican Republic and median male earnings in the United States with a correlation coefficient (R) of -0.576 and weighted average of $46,655, a difference of 0.16%.
Median Male Earnings Correlation Summary
| Measurement | Cuban | Immigrants from Dominican Republic |
| Minimum | $18,938 | $24,931 |
| Maximum | $70,693 | $56,014 |
| Range | $51,755 | $31,083 |
| Mean | $43,444 | $41,875 |
| Median | $42,447 | $41,710 |
| Interquartile 25% (IQ1) | $37,372 | $35,983 |
| Interquartile 75% (IQ3) | $47,400 | $47,499 |
| Interquartile Range (IQR) | $10,028 | $11,516 |
| Standard Deviation (Sample) | $8,309 | $7,016 |
| Standard Deviation (Population) | $8,270 | $6,972 |
Demographics Similar to Cubans and Immigrants from Dominican Republic by Median Male Earnings
In terms of median male earnings, the demographic groups most similar to Cubans are Creek ($46,594, a difference of 0.030%), Ottawa ($46,611, a difference of 0.070%), Dutch West Indian ($46,656, a difference of 0.16%), Apache ($46,429, a difference of 0.33%), and Guatemalan ($46,736, a difference of 0.34%). Similarly, the demographic groups most similar to Immigrants from Dominican Republic are Dutch West Indian ($46,656, a difference of 0.0%), Ottawa ($46,611, a difference of 0.090%), Creek ($46,594, a difference of 0.13%), Guatemalan ($46,736, a difference of 0.17%), and Bangladeshi ($46,744, a difference of 0.19%).
| Demographics | Rating | Rank | Median Male Earnings |
| Immigrants | Micronesia | 0.1 /100 | #298 | Tragic $47,177 |
| Immigrants | Zaire | 0.1 /100 | #299 | Tragic $47,070 |
| U.S. Virgin Islanders | 0.1 /100 | #300 | Tragic $47,066 |
| Immigrants | Latin America | 0.1 /100 | #301 | Tragic $46,941 |
| Seminole | 0.1 /100 | #302 | Tragic $46,783 |
| Yaqui | 0.1 /100 | #303 | Tragic $46,777 |
| Bangladeshis | 0.1 /100 | #304 | Tragic $46,744 |
| Guatemalans | 0.0 /100 | #305 | Tragic $46,736 |
| Dutch West Indians | 0.0 /100 | #306 | Tragic $46,656 |
| Immigrants | Dominican Republic | 0.0 /100 | #307 | Tragic $46,655 |
| Ottawa | 0.0 /100 | #308 | Tragic $46,611 |
| Creek | 0.0 /100 | #309 | Tragic $46,594 |
| Cubans | 0.0 /100 | #310 | Tragic $46,580 |
| Apache | 0.0 /100 | #311 | Tragic $46,429 |
| Hispanics or Latinos | 0.0 /100 | #312 | Tragic $46,419 |
| Hondurans | 0.0 /100 | #313 | Tragic $46,374 |
| Chippewa | 0.0 /100 | #314 | Tragic $46,368 |
| Immigrants | Guatemala | 0.0 /100 | #315 | Tragic $46,244 |
| Immigrants | Caribbean | 0.0 /100 | #316 | Tragic $46,193 |
| Mexicans | 0.0 /100 | #317 | Tragic $46,147 |
| Cheyenne | 0.0 /100 | #318 | Tragic $46,062 |