Cuban vs Liberian Median Male Earnings
COMPARE
Cuban
Liberian
Median Male Earnings
Median Male Earnings Comparison
Cubans
Liberians
$46,580
MEDIAN MALE EARNINGS
0.0/ 100
METRIC RATING
310th/ 347
METRIC RANK
$49,318
MEDIAN MALE EARNINGS
0.6/ 100
METRIC RATING
261st/ 347
METRIC RANK
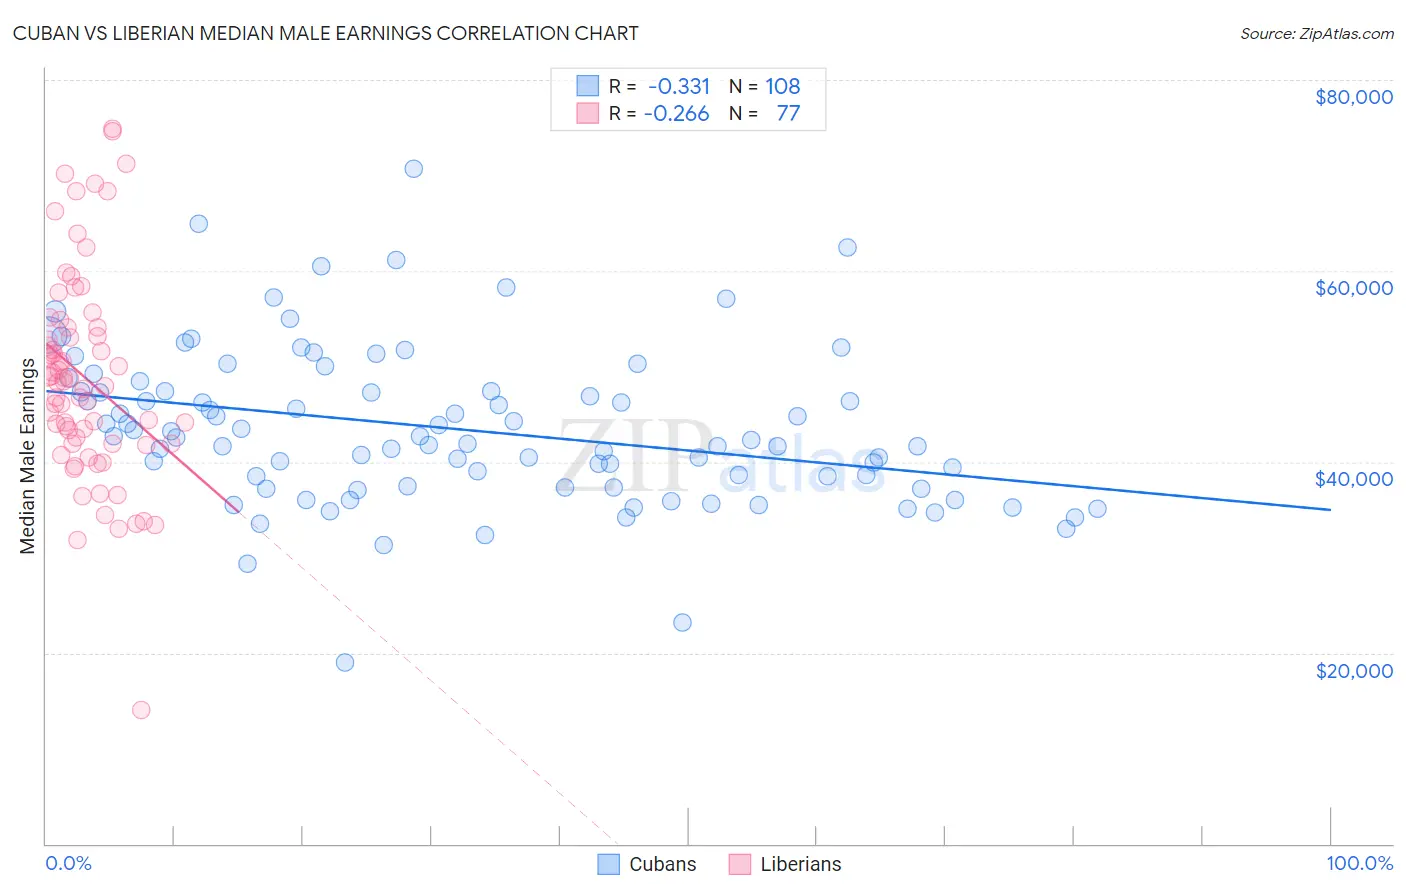
Cuban vs Liberian Median Male Earnings Correlation Chart
The statistical analysis conducted on geographies consisting of 449,183,844 people shows a mild negative correlation between the proportion of Cubans and median male earnings in the United States with a correlation coefficient (R) of -0.331 and weighted average of $46,580. Similarly, the statistical analysis conducted on geographies consisting of 118,095,267 people shows a weak negative correlation between the proportion of Liberians and median male earnings in the United States with a correlation coefficient (R) of -0.266 and weighted average of $49,318, a difference of 5.9%.
Median Male Earnings Correlation Summary
| Measurement | Cuban | Liberian |
| Minimum | $18,938 | $14,075 |
| Maximum | $70,693 | $74,924 |
| Range | $51,755 | $60,849 |
| Mean | $43,444 | $48,884 |
| Median | $42,447 | $48,498 |
| Interquartile 25% (IQ1) | $37,372 | $41,872 |
| Interquartile 75% (IQ3) | $47,400 | $54,038 |
| Interquartile Range (IQR) | $10,028 | $12,166 |
| Standard Deviation (Sample) | $8,309 | $10,904 |
| Standard Deviation (Population) | $8,270 | $10,833 |
Similar Demographics by Median Male Earnings
Demographics Similar to Cubans by Median Male Earnings
In terms of median male earnings, the demographic groups most similar to Cubans are Creek ($46,594, a difference of 0.030%), Ottawa ($46,611, a difference of 0.070%), Dutch West Indian ($46,656, a difference of 0.16%), Immigrants from Dominican Republic ($46,655, a difference of 0.16%), and Apache ($46,429, a difference of 0.33%).
| Demographics | Rating | Rank | Median Male Earnings |
| Yaqui | 0.1 /100 | #303 | Tragic $46,777 |
| Bangladeshis | 0.1 /100 | #304 | Tragic $46,744 |
| Guatemalans | 0.0 /100 | #305 | Tragic $46,736 |
| Dutch West Indians | 0.0 /100 | #306 | Tragic $46,656 |
| Immigrants | Dominican Republic | 0.0 /100 | #307 | Tragic $46,655 |
| Ottawa | 0.0 /100 | #308 | Tragic $46,611 |
| Creek | 0.0 /100 | #309 | Tragic $46,594 |
| Cubans | 0.0 /100 | #310 | Tragic $46,580 |
| Apache | 0.0 /100 | #311 | Tragic $46,429 |
| Hispanics or Latinos | 0.0 /100 | #312 | Tragic $46,419 |
| Hondurans | 0.0 /100 | #313 | Tragic $46,374 |
| Chippewa | 0.0 /100 | #314 | Tragic $46,368 |
| Immigrants | Guatemala | 0.0 /100 | #315 | Tragic $46,244 |
| Immigrants | Caribbean | 0.0 /100 | #316 | Tragic $46,193 |
| Mexicans | 0.0 /100 | #317 | Tragic $46,147 |
Demographics Similar to Liberians by Median Male Earnings
In terms of median male earnings, the demographic groups most similar to Liberians are Immigrants from West Indies ($49,271, a difference of 0.10%), Iroquois ($49,374, a difference of 0.11%), Nicaraguan ($49,215, a difference of 0.21%), Immigrants from Middle Africa ($49,201, a difference of 0.24%), and Immigrants from Laos ($49,190, a difference of 0.26%).
| Demographics | Rating | Rank | Median Male Earnings |
| Senegalese | 1.0 /100 | #254 | Tragic $49,774 |
| Alaskan Athabascans | 0.9 /100 | #255 | Tragic $49,748 |
| Alaska Natives | 0.9 /100 | #256 | Tragic $49,711 |
| British West Indians | 0.8 /100 | #257 | Tragic $49,636 |
| Cree | 0.7 /100 | #258 | Tragic $49,497 |
| Nepalese | 0.7 /100 | #259 | Tragic $49,458 |
| Iroquois | 0.7 /100 | #260 | Tragic $49,374 |
| Liberians | 0.6 /100 | #261 | Tragic $49,318 |
| Immigrants | West Indies | 0.6 /100 | #262 | Tragic $49,271 |
| Nicaraguans | 0.6 /100 | #263 | Tragic $49,215 |
| Immigrants | Middle Africa | 0.6 /100 | #264 | Tragic $49,201 |
| Immigrants | Laos | 0.6 /100 | #265 | Tragic $49,190 |
| Somalis | 0.5 /100 | #266 | Tragic $49,025 |
| Spanish Americans | 0.5 /100 | #267 | Tragic $49,008 |
| Ute | 0.4 /100 | #268 | Tragic $48,899 |