Cuban vs Immigrants from Austria Median Male Earnings
COMPARE
Cuban
Immigrants from Austria
Median Male Earnings
Median Male Earnings Comparison
Cubans
Immigrants from Austria
$46,580
MEDIAN MALE EARNINGS
0.0/ 100
METRIC RATING
310th/ 347
METRIC RANK
$62,164
MEDIAN MALE EARNINGS
99.9/ 100
METRIC RATING
47th/ 347
METRIC RANK
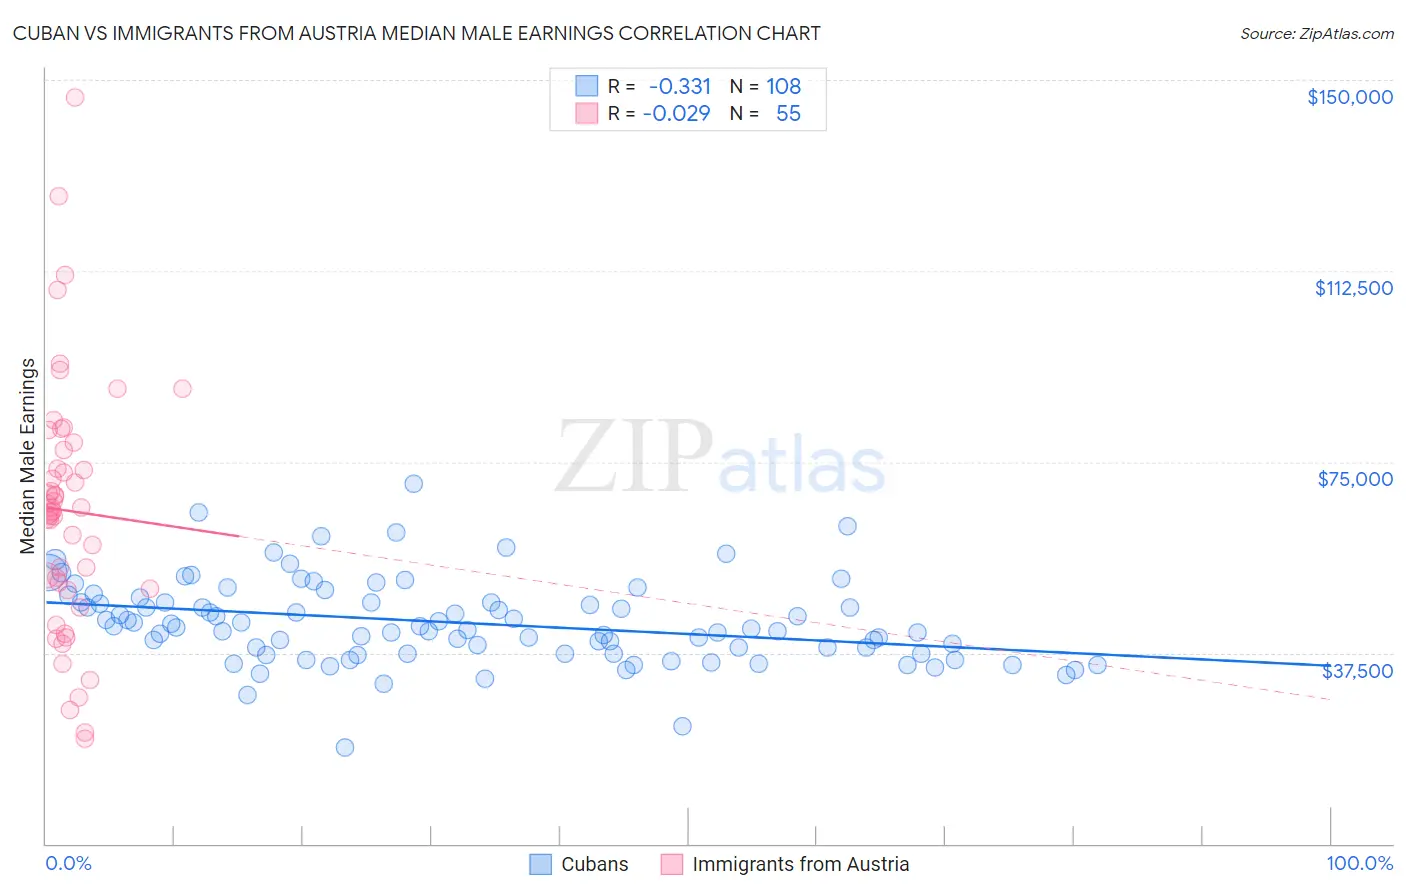
Cuban vs Immigrants from Austria Median Male Earnings Correlation Chart
The statistical analysis conducted on geographies consisting of 449,183,844 people shows a mild negative correlation between the proportion of Cubans and median male earnings in the United States with a correlation coefficient (R) of -0.331 and weighted average of $46,580. Similarly, the statistical analysis conducted on geographies consisting of 167,941,701 people shows no correlation between the proportion of Immigrants from Austria and median male earnings in the United States with a correlation coefficient (R) of -0.029 and weighted average of $62,164, a difference of 33.5%.
Median Male Earnings Correlation Summary
| Measurement | Cuban | Immigrants from Austria |
| Minimum | $18,938 | $20,568 |
| Maximum | $70,693 | $146,444 |
| Range | $51,755 | $125,876 |
| Mean | $43,444 | $65,411 |
| Median | $42,447 | $65,258 |
| Interquartile 25% (IQ1) | $37,372 | $50,000 |
| Interquartile 75% (IQ3) | $47,400 | $77,315 |
| Interquartile Range (IQR) | $10,028 | $27,315 |
| Standard Deviation (Sample) | $8,309 | $24,493 |
| Standard Deviation (Population) | $8,270 | $24,269 |
Similar Demographics by Median Male Earnings
Demographics Similar to Cubans by Median Male Earnings
In terms of median male earnings, the demographic groups most similar to Cubans are Creek ($46,594, a difference of 0.030%), Ottawa ($46,611, a difference of 0.070%), Dutch West Indian ($46,656, a difference of 0.16%), Immigrants from Dominican Republic ($46,655, a difference of 0.16%), and Apache ($46,429, a difference of 0.33%).
| Demographics | Rating | Rank | Median Male Earnings |
| Yaqui | 0.1 /100 | #303 | Tragic $46,777 |
| Bangladeshis | 0.1 /100 | #304 | Tragic $46,744 |
| Guatemalans | 0.0 /100 | #305 | Tragic $46,736 |
| Dutch West Indians | 0.0 /100 | #306 | Tragic $46,656 |
| Immigrants | Dominican Republic | 0.0 /100 | #307 | Tragic $46,655 |
| Ottawa | 0.0 /100 | #308 | Tragic $46,611 |
| Creek | 0.0 /100 | #309 | Tragic $46,594 |
| Cubans | 0.0 /100 | #310 | Tragic $46,580 |
| Apache | 0.0 /100 | #311 | Tragic $46,429 |
| Hispanics or Latinos | 0.0 /100 | #312 | Tragic $46,419 |
| Hondurans | 0.0 /100 | #313 | Tragic $46,374 |
| Chippewa | 0.0 /100 | #314 | Tragic $46,368 |
| Immigrants | Guatemala | 0.0 /100 | #315 | Tragic $46,244 |
| Immigrants | Caribbean | 0.0 /100 | #316 | Tragic $46,193 |
| Mexicans | 0.0 /100 | #317 | Tragic $46,147 |
Demographics Similar to Immigrants from Austria by Median Male Earnings
In terms of median male earnings, the demographic groups most similar to Immigrants from Austria are Immigrants from Malaysia ($62,121, a difference of 0.070%), Immigrants from Czechoslovakia ($62,217, a difference of 0.090%), Immigrants from Europe ($62,057, a difference of 0.17%), Bulgarian ($62,378, a difference of 0.35%), and Cambodian ($62,516, a difference of 0.57%).
| Demographics | Rating | Rank | Median Male Earnings |
| Australians | 100.0 /100 | #40 | Exceptional $62,857 |
| Immigrants | Turkey | 100.0 /100 | #41 | Exceptional $62,728 |
| Immigrants | Greece | 100.0 /100 | #42 | Exceptional $62,689 |
| Immigrants | Belarus | 100.0 /100 | #43 | Exceptional $62,658 |
| Cambodians | 100.0 /100 | #44 | Exceptional $62,516 |
| Bulgarians | 100.0 /100 | #45 | Exceptional $62,378 |
| Immigrants | Czechoslovakia | 99.9 /100 | #46 | Exceptional $62,217 |
| Immigrants | Austria | 99.9 /100 | #47 | Exceptional $62,164 |
| Immigrants | Malaysia | 99.9 /100 | #48 | Exceptional $62,121 |
| Immigrants | Europe | 99.9 /100 | #49 | Exceptional $62,057 |
| Bhutanese | 99.9 /100 | #50 | Exceptional $61,759 |
| Estonians | 99.9 /100 | #51 | Exceptional $61,710 |
| Immigrants | Norway | 99.9 /100 | #52 | Exceptional $61,628 |
| South Africans | 99.9 /100 | #53 | Exceptional $61,460 |
| Immigrants | Latvia | 99.9 /100 | #54 | Exceptional $61,422 |