Cuban vs Thai Median Male Earnings
COMPARE
Cuban
Thai
Median Male Earnings
Median Male Earnings Comparison
Cubans
Thais
$46,580
MEDIAN MALE EARNINGS
0.0/ 100
METRIC RATING
310th/ 347
METRIC RANK
$72,135
MEDIAN MALE EARNINGS
100.0/ 100
METRIC RATING
4th/ 347
METRIC RANK
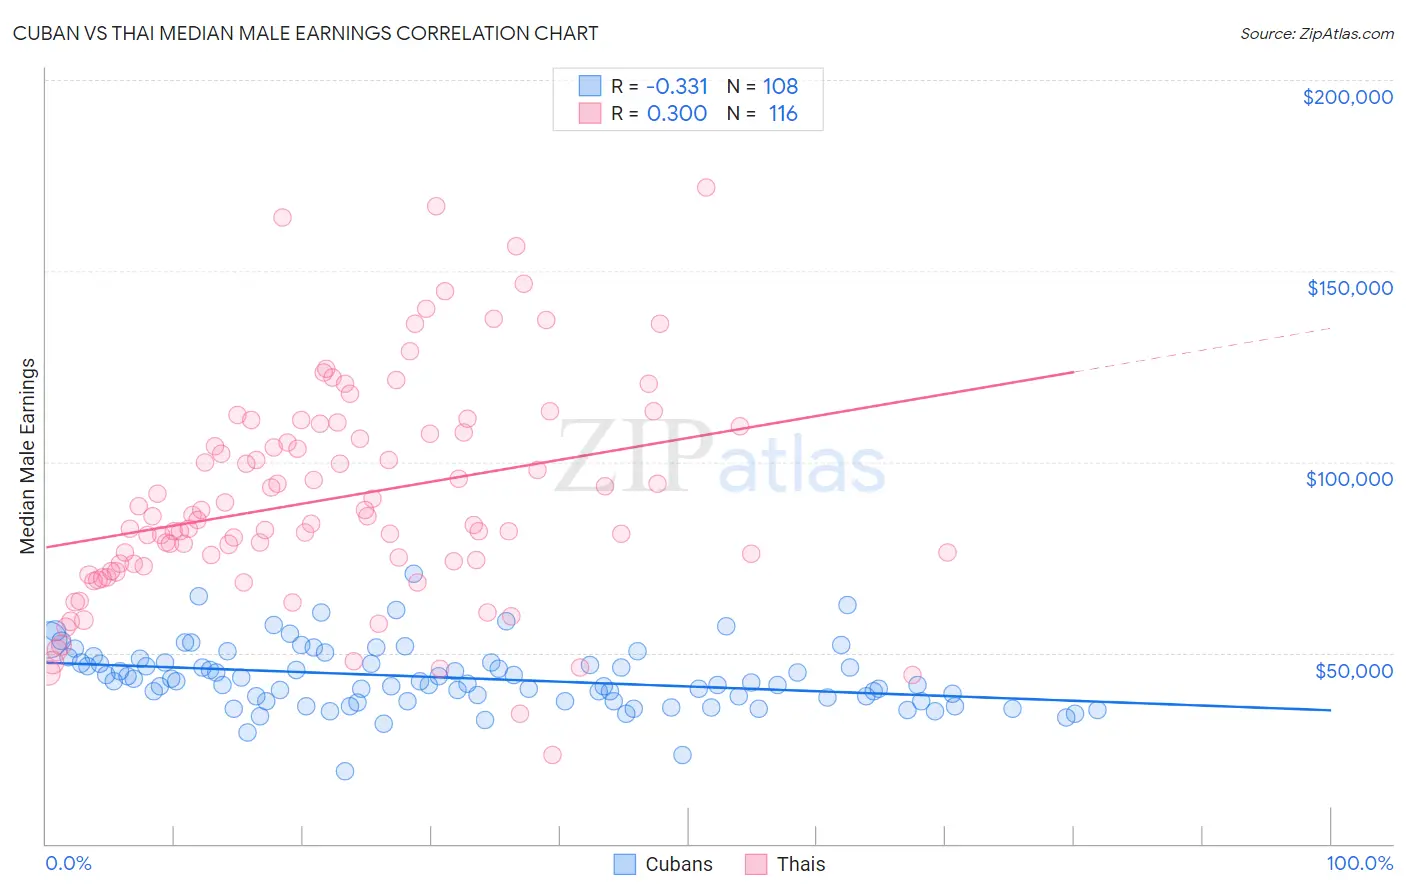
Cuban vs Thai Median Male Earnings Correlation Chart
The statistical analysis conducted on geographies consisting of 449,183,844 people shows a mild negative correlation between the proportion of Cubans and median male earnings in the United States with a correlation coefficient (R) of -0.331 and weighted average of $46,580. Similarly, the statistical analysis conducted on geographies consisting of 475,691,954 people shows a weak positive correlation between the proportion of Thais and median male earnings in the United States with a correlation coefficient (R) of 0.300 and weighted average of $72,135, a difference of 54.9%.
Median Male Earnings Correlation Summary
| Measurement | Cuban | Thai |
| Minimum | $18,938 | $23,362 |
| Maximum | $70,693 | $171,875 |
| Range | $51,755 | $148,513 |
| Mean | $43,444 | $90,264 |
| Median | $42,447 | $84,301 |
| Interquartile 25% (IQ1) | $37,372 | $73,018 |
| Interquartile 75% (IQ3) | $47,400 | $107,587 |
| Interquartile Range (IQR) | $10,028 | $34,569 |
| Standard Deviation (Sample) | $8,309 | $28,453 |
| Standard Deviation (Population) | $8,270 | $28,330 |
Similar Demographics by Median Male Earnings
Demographics Similar to Cubans by Median Male Earnings
In terms of median male earnings, the demographic groups most similar to Cubans are Creek ($46,594, a difference of 0.030%), Ottawa ($46,611, a difference of 0.070%), Dutch West Indian ($46,656, a difference of 0.16%), Immigrants from Dominican Republic ($46,655, a difference of 0.16%), and Apache ($46,429, a difference of 0.33%).
| Demographics | Rating | Rank | Median Male Earnings |
| Yaqui | 0.1 /100 | #303 | Tragic $46,777 |
| Bangladeshis | 0.1 /100 | #304 | Tragic $46,744 |
| Guatemalans | 0.0 /100 | #305 | Tragic $46,736 |
| Dutch West Indians | 0.0 /100 | #306 | Tragic $46,656 |
| Immigrants | Dominican Republic | 0.0 /100 | #307 | Tragic $46,655 |
| Ottawa | 0.0 /100 | #308 | Tragic $46,611 |
| Creek | 0.0 /100 | #309 | Tragic $46,594 |
| Cubans | 0.0 /100 | #310 | Tragic $46,580 |
| Apache | 0.0 /100 | #311 | Tragic $46,429 |
| Hispanics or Latinos | 0.0 /100 | #312 | Tragic $46,419 |
| Hondurans | 0.0 /100 | #313 | Tragic $46,374 |
| Chippewa | 0.0 /100 | #314 | Tragic $46,368 |
| Immigrants | Guatemala | 0.0 /100 | #315 | Tragic $46,244 |
| Immigrants | Caribbean | 0.0 /100 | #316 | Tragic $46,193 |
| Mexicans | 0.0 /100 | #317 | Tragic $46,147 |
Demographics Similar to Thais by Median Male Earnings
In terms of median male earnings, the demographic groups most similar to Thais are Immigrants from Singapore ($71,348, a difference of 1.1%), Iranian ($70,648, a difference of 2.1%), Immigrants from Taiwan ($74,031, a difference of 2.6%), Immigrants from Hong Kong ($70,146, a difference of 2.8%), and Immigrants from India ($74,207, a difference of 2.9%).
| Demographics | Rating | Rank | Median Male Earnings |
| Filipinos | 100.0 /100 | #1 | Exceptional $74,224 |
| Immigrants | India | 100.0 /100 | #2 | Exceptional $74,207 |
| Immigrants | Taiwan | 100.0 /100 | #3 | Exceptional $74,031 |
| Thais | 100.0 /100 | #4 | Exceptional $72,135 |
| Immigrants | Singapore | 100.0 /100 | #5 | Exceptional $71,348 |
| Iranians | 100.0 /100 | #6 | Exceptional $70,648 |
| Immigrants | Hong Kong | 100.0 /100 | #7 | Exceptional $70,146 |
| Immigrants | Iran | 100.0 /100 | #8 | Exceptional $69,284 |
| Immigrants | South Central Asia | 100.0 /100 | #9 | Exceptional $68,960 |
| Immigrants | Israel | 100.0 /100 | #10 | Exceptional $68,716 |
| Immigrants | Ireland | 100.0 /100 | #11 | Exceptional $67,698 |
| Immigrants | Australia | 100.0 /100 | #12 | Exceptional $67,634 |
| Immigrants | China | 100.0 /100 | #13 | Exceptional $67,353 |
| Okinawans | 100.0 /100 | #14 | Exceptional $67,232 |
| Immigrants | Eastern Asia | 100.0 /100 | #15 | Exceptional $66,903 |