Cuban vs Immigrants from Dominican Republic Female Disability
COMPARE
Cuban
Immigrants from Dominican Republic
Female Disability
Female Disability Comparison
Cubans
Immigrants from Dominican Republic
12.3%
FEMALE DISABILITY
36.5/ 100
METRIC RATING
183rd/ 347
METRIC RANK
13.4%
FEMALE DISABILITY
0.0/ 100
METRIC RATING
299th/ 347
METRIC RANK
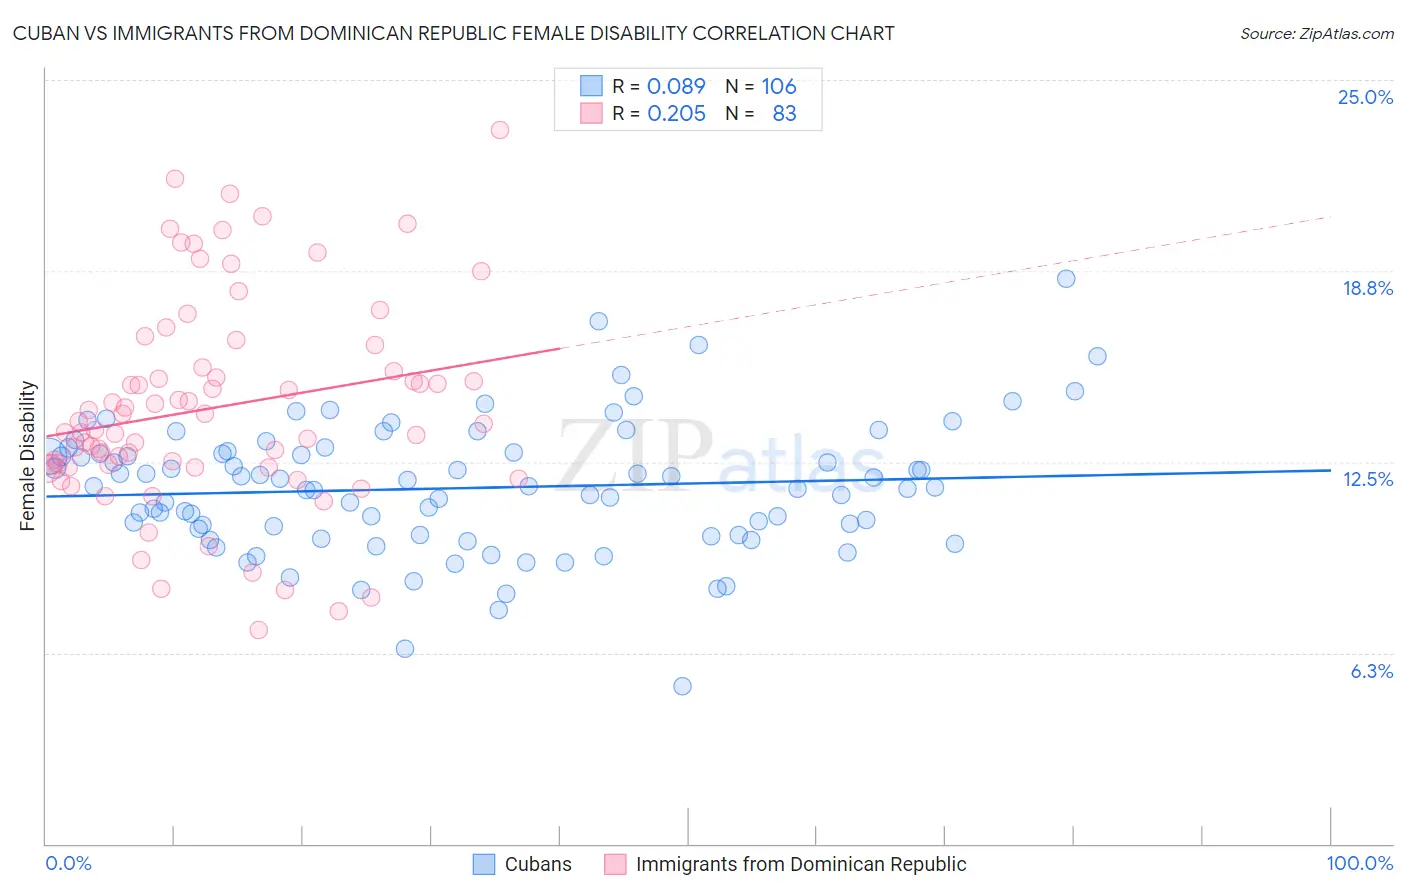
Cuban vs Immigrants from Dominican Republic Female Disability Correlation Chart
The statistical analysis conducted on geographies consisting of 449,245,212 people shows a slight positive correlation between the proportion of Cubans and percentage of females with a disability in the United States with a correlation coefficient (R) of 0.089 and weighted average of 12.3%. Similarly, the statistical analysis conducted on geographies consisting of 275,087,890 people shows a weak positive correlation between the proportion of Immigrants from Dominican Republic and percentage of females with a disability in the United States with a correlation coefficient (R) of 0.205 and weighted average of 13.4%, a difference of 9.3%.
Female Disability Correlation Summary
| Measurement | Cuban | Immigrants from Dominican Republic |
| Minimum | 5.2% | 7.0% |
| Maximum | 18.5% | 23.4% |
| Range | 13.3% | 16.4% |
| Mean | 11.6% | 14.3% |
| Median | 11.7% | 13.7% |
| Interquartile 25% (IQ1) | 10.1% | 12.3% |
| Interquartile 75% (IQ3) | 12.8% | 15.6% |
| Interquartile Range (IQR) | 2.7% | 3.3% |
| Standard Deviation (Sample) | 2.1% | 3.4% |
| Standard Deviation (Population) | 2.1% | 3.4% |
Similar Demographics by Female Disability
Demographics Similar to Cubans by Female Disability
In terms of female disability, the demographic groups most similar to Cubans are Norwegian (12.3%, a difference of 0.020%), Iraqi (12.3%, a difference of 0.020%), Immigrants from Canada (12.3%, a difference of 0.030%), Albanian (12.3%, a difference of 0.060%), and Immigrants from Fiji (12.3%, a difference of 0.070%).
| Demographics | Rating | Rank | Female Disability |
| Immigrants | Guyana | 43.1 /100 | #176 | Average 12.2% |
| Immigrants | Ghana | 42.5 /100 | #177 | Average 12.2% |
| Immigrants | Western Europe | 40.9 /100 | #178 | Average 12.2% |
| Immigrants | Fiji | 38.2 /100 | #179 | Fair 12.3% |
| Albanians | 37.9 /100 | #180 | Fair 12.3% |
| Immigrants | Canada | 37.2 /100 | #181 | Fair 12.3% |
| Norwegians | 36.9 /100 | #182 | Fair 12.3% |
| Cubans | 36.5 /100 | #183 | Fair 12.3% |
| Iraqis | 36.0 /100 | #184 | Fair 12.3% |
| Immigrants | Uzbekistan | 33.9 /100 | #185 | Fair 12.3% |
| Austrians | 33.3 /100 | #186 | Fair 12.3% |
| Serbians | 33.1 /100 | #187 | Fair 12.3% |
| Immigrants | North America | 32.8 /100 | #188 | Fair 12.3% |
| Immigrants | Albania | 31.6 /100 | #189 | Fair 12.3% |
| Immigrants | Honduras | 31.3 /100 | #190 | Fair 12.3% |
Demographics Similar to Immigrants from Dominican Republic by Female Disability
In terms of female disability, the demographic groups most similar to Immigrants from Dominican Republic are Pennsylvania German (13.4%, a difference of 0.010%), African (13.4%, a difference of 0.21%), Nonimmigrants (13.4%, a difference of 0.26%), Scotch-Irish (13.4%, a difference of 0.35%), and Immigrants from Portugal (13.5%, a difference of 0.35%).
| Demographics | Rating | Rank | Female Disability |
| Yakama | 0.0 /100 | #292 | Tragic 13.2% |
| Marshallese | 0.0 /100 | #293 | Tragic 13.3% |
| Celtics | 0.0 /100 | #294 | Tragic 13.3% |
| French | 0.0 /100 | #295 | Tragic 13.3% |
| Nepalese | 0.0 /100 | #296 | Tragic 13.3% |
| Slovaks | 0.0 /100 | #297 | Tragic 13.3% |
| Immigrants | Nonimmigrants | 0.0 /100 | #298 | Tragic 13.4% |
| Immigrants | Dominican Republic | 0.0 /100 | #299 | Tragic 13.4% |
| Pennsylvania Germans | 0.0 /100 | #300 | Tragic 13.4% |
| Africans | 0.0 /100 | #301 | Tragic 13.4% |
| Scotch-Irish | 0.0 /100 | #302 | Tragic 13.4% |
| Immigrants | Portugal | 0.0 /100 | #303 | Tragic 13.5% |
| Immigrants | Micronesia | 0.0 /100 | #304 | Tragic 13.5% |
| Dominicans | 0.0 /100 | #305 | Tragic 13.5% |
| French Canadians | 0.0 /100 | #306 | Tragic 13.6% |