Yuman vs Immigrants from Dominican Republic Median Male Earnings
COMPARE
Yuman
Immigrants from Dominican Republic
Median Male Earnings
Median Male Earnings Comparison
Yuman
Immigrants from Dominican Republic
$45,446
MEDIAN MALE EARNINGS
0.0/ 100
METRIC RATING
325th/ 347
METRIC RANK
$46,655
MEDIAN MALE EARNINGS
0.0/ 100
METRIC RATING
307th/ 347
METRIC RANK
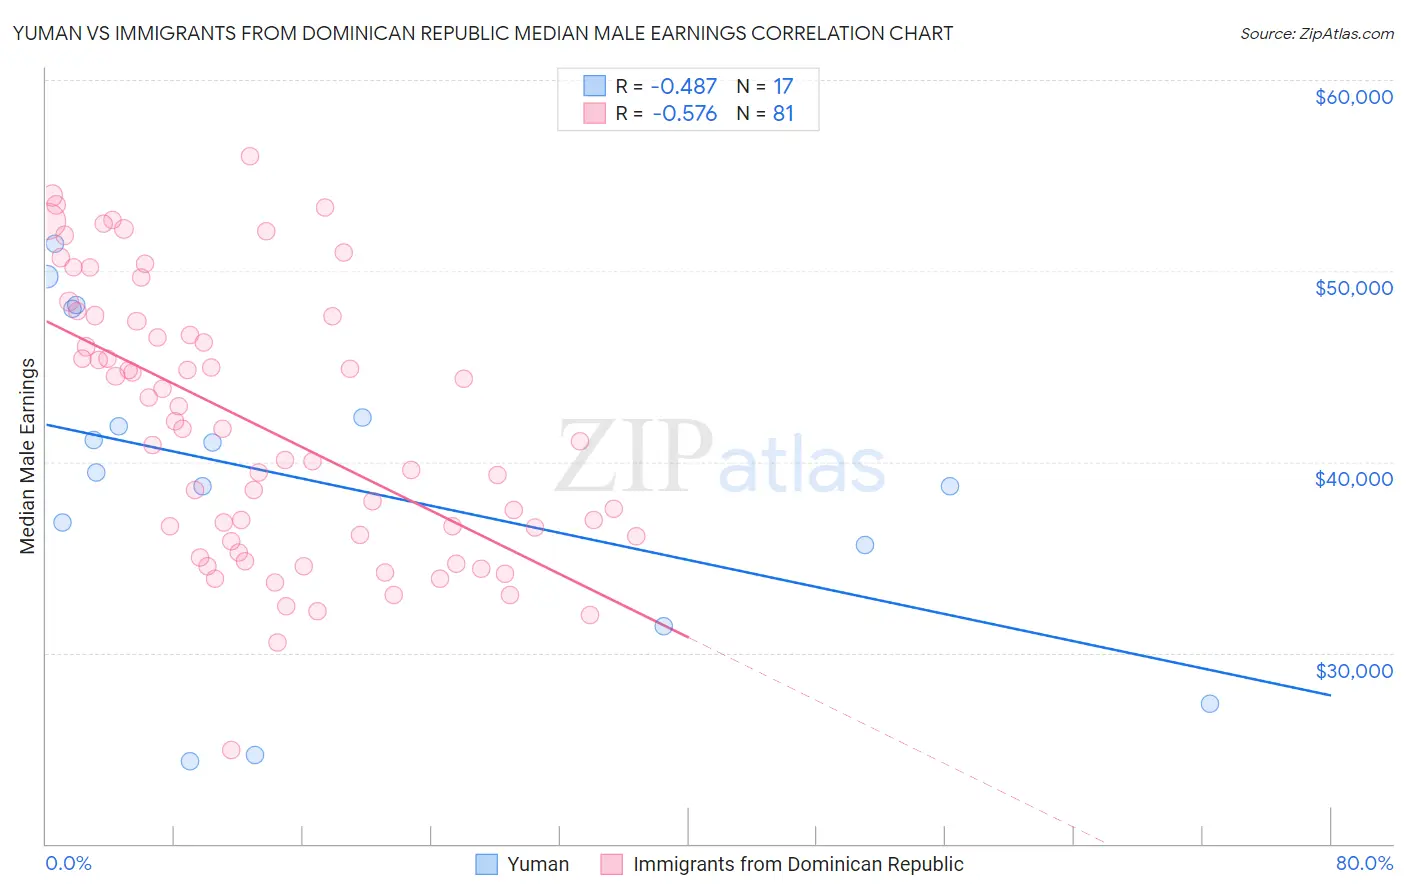
Yuman vs Immigrants from Dominican Republic Median Male Earnings Correlation Chart
The statistical analysis conducted on geographies consisting of 40,680,371 people shows a moderate negative correlation between the proportion of Yuman and median male earnings in the United States with a correlation coefficient (R) of -0.487 and weighted average of $45,446. Similarly, the statistical analysis conducted on geographies consisting of 274,998,271 people shows a substantial negative correlation between the proportion of Immigrants from Dominican Republic and median male earnings in the United States with a correlation coefficient (R) of -0.576 and weighted average of $46,655, a difference of 2.7%.
Median Male Earnings Correlation Summary
| Measurement | Yuman | Immigrants from Dominican Republic |
| Minimum | $24,301 | $24,931 |
| Maximum | $51,445 | $56,014 |
| Range | $27,144 | $31,083 |
| Mean | $38,868 | $41,875 |
| Median | $39,436 | $41,710 |
| Interquartile 25% (IQ1) | $33,507 | $35,983 |
| Interquartile 75% (IQ3) | $45,172 | $47,499 |
| Interquartile Range (IQR) | $11,665 | $11,516 |
| Standard Deviation (Sample) | $8,269 | $7,016 |
| Standard Deviation (Population) | $8,022 | $6,972 |
Demographics Similar to Yuman and Immigrants from Dominican Republic by Median Male Earnings
In terms of median male earnings, the demographic groups most similar to Yuman are Black/African American ($45,523, a difference of 0.17%), Immigrants from Central America ($45,538, a difference of 0.20%), Sioux ($45,566, a difference of 0.26%), Fijian ($45,607, a difference of 0.35%), and Immigrants from Haiti ($45,266, a difference of 0.40%). Similarly, the demographic groups most similar to Immigrants from Dominican Republic are Dutch West Indian ($46,656, a difference of 0.0%), Ottawa ($46,611, a difference of 0.090%), Creek ($46,594, a difference of 0.13%), Cuban ($46,580, a difference of 0.16%), and Apache ($46,429, a difference of 0.49%).
| Demographics | Rating | Rank | Median Male Earnings |
| Dutch West Indians | 0.0 /100 | #306 | Tragic $46,656 |
| Immigrants | Dominican Republic | 0.0 /100 | #307 | Tragic $46,655 |
| Ottawa | 0.0 /100 | #308 | Tragic $46,611 |
| Creek | 0.0 /100 | #309 | Tragic $46,594 |
| Cubans | 0.0 /100 | #310 | Tragic $46,580 |
| Apache | 0.0 /100 | #311 | Tragic $46,429 |
| Hispanics or Latinos | 0.0 /100 | #312 | Tragic $46,419 |
| Hondurans | 0.0 /100 | #313 | Tragic $46,374 |
| Chippewa | 0.0 /100 | #314 | Tragic $46,368 |
| Immigrants | Guatemala | 0.0 /100 | #315 | Tragic $46,244 |
| Immigrants | Caribbean | 0.0 /100 | #316 | Tragic $46,193 |
| Mexicans | 0.0 /100 | #317 | Tragic $46,147 |
| Cheyenne | 0.0 /100 | #318 | Tragic $46,062 |
| Haitians | 0.0 /100 | #319 | Tragic $45,903 |
| Immigrants | Honduras | 0.0 /100 | #320 | Tragic $45,787 |
| Fijians | 0.0 /100 | #321 | Tragic $45,607 |
| Sioux | 0.0 /100 | #322 | Tragic $45,566 |
| Immigrants | Central America | 0.0 /100 | #323 | Tragic $45,538 |
| Blacks/African Americans | 0.0 /100 | #324 | Tragic $45,523 |
| Yuman | 0.0 /100 | #325 | Tragic $45,446 |
| Immigrants | Haiti | 0.0 /100 | #326 | Tragic $45,266 |