Cuban vs Mexican American Indian Median Male Earnings
COMPARE
Cuban
Mexican American Indian
Median Male Earnings
Median Male Earnings Comparison
Cubans
Mexican American Indians
$46,580
MEDIAN MALE EARNINGS
0.0/ 100
METRIC RATING
310th/ 347
METRIC RANK
$47,990
MEDIAN MALE EARNINGS
0.2/ 100
METRIC RATING
286th/ 347
METRIC RANK
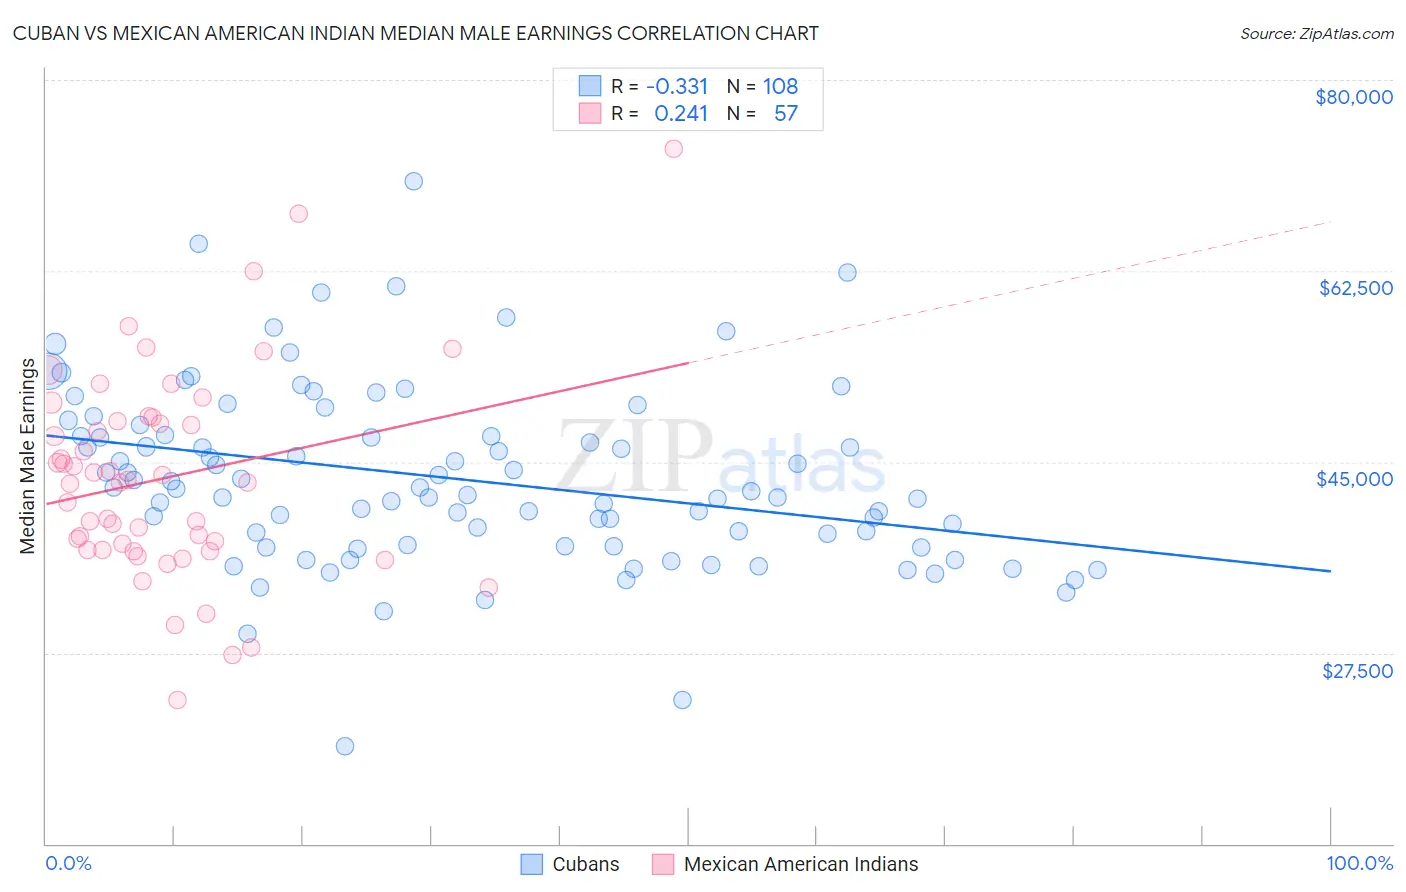
Cuban vs Mexican American Indian Median Male Earnings Correlation Chart
The statistical analysis conducted on geographies consisting of 449,183,844 people shows a mild negative correlation between the proportion of Cubans and median male earnings in the United States with a correlation coefficient (R) of -0.331 and weighted average of $46,580. Similarly, the statistical analysis conducted on geographies consisting of 317,531,084 people shows a weak positive correlation between the proportion of Mexican American Indians and median male earnings in the United States with a correlation coefficient (R) of 0.241 and weighted average of $47,990, a difference of 3.0%.
Median Male Earnings Correlation Summary
| Measurement | Cuban | Mexican American Indian |
| Minimum | $18,938 | $23,167 |
| Maximum | $70,693 | $73,750 |
| Range | $51,755 | $50,583 |
| Mean | $43,444 | $43,547 |
| Median | $42,447 | $43,107 |
| Interquartile 25% (IQ1) | $37,372 | $36,938 |
| Interquartile 75% (IQ3) | $47,400 | $48,895 |
| Interquartile Range (IQR) | $10,028 | $11,957 |
| Standard Deviation (Sample) | $8,309 | $9,541 |
| Standard Deviation (Population) | $8,270 | $9,457 |
Similar Demographics by Median Male Earnings
Demographics Similar to Cubans by Median Male Earnings
In terms of median male earnings, the demographic groups most similar to Cubans are Creek ($46,594, a difference of 0.030%), Ottawa ($46,611, a difference of 0.070%), Dutch West Indian ($46,656, a difference of 0.16%), Immigrants from Dominican Republic ($46,655, a difference of 0.16%), and Apache ($46,429, a difference of 0.33%).
| Demographics | Rating | Rank | Median Male Earnings |
| Yaqui | 0.1 /100 | #303 | Tragic $46,777 |
| Bangladeshis | 0.1 /100 | #304 | Tragic $46,744 |
| Guatemalans | 0.0 /100 | #305 | Tragic $46,736 |
| Dutch West Indians | 0.0 /100 | #306 | Tragic $46,656 |
| Immigrants | Dominican Republic | 0.0 /100 | #307 | Tragic $46,655 |
| Ottawa | 0.0 /100 | #308 | Tragic $46,611 |
| Creek | 0.0 /100 | #309 | Tragic $46,594 |
| Cubans | 0.0 /100 | #310 | Tragic $46,580 |
| Apache | 0.0 /100 | #311 | Tragic $46,429 |
| Hispanics or Latinos | 0.0 /100 | #312 | Tragic $46,419 |
| Hondurans | 0.0 /100 | #313 | Tragic $46,374 |
| Chippewa | 0.0 /100 | #314 | Tragic $46,368 |
| Immigrants | Guatemala | 0.0 /100 | #315 | Tragic $46,244 |
| Immigrants | Caribbean | 0.0 /100 | #316 | Tragic $46,193 |
| Mexicans | 0.0 /100 | #317 | Tragic $46,147 |
Demographics Similar to Mexican American Indians by Median Male Earnings
In terms of median male earnings, the demographic groups most similar to Mexican American Indians are Paiute ($47,991, a difference of 0.0%), African ($47,994, a difference of 0.010%), Immigrants from El Salvador ($47,973, a difference of 0.040%), Immigrants from Jamaica ($48,040, a difference of 0.10%), and Shoshone ($47,930, a difference of 0.12%).
| Demographics | Rating | Rank | Median Male Earnings |
| Hmong | 0.2 /100 | #279 | Tragic $48,254 |
| Comanche | 0.2 /100 | #280 | Tragic $48,202 |
| Marshallese | 0.2 /100 | #281 | Tragic $48,137 |
| Central Americans | 0.2 /100 | #282 | Tragic $48,093 |
| Immigrants | Jamaica | 0.2 /100 | #283 | Tragic $48,040 |
| Africans | 0.2 /100 | #284 | Tragic $47,994 |
| Paiute | 0.2 /100 | #285 | Tragic $47,991 |
| Mexican American Indians | 0.2 /100 | #286 | Tragic $47,990 |
| Immigrants | El Salvador | 0.2 /100 | #287 | Tragic $47,973 |
| Shoshone | 0.2 /100 | #288 | Tragic $47,930 |
| Chickasaw | 0.1 /100 | #289 | Tragic $47,832 |
| Immigrants | Belize | 0.1 /100 | #290 | Tragic $47,809 |
| Choctaw | 0.1 /100 | #291 | Tragic $47,729 |
| Immigrants | Dominica | 0.1 /100 | #292 | Tragic $47,651 |
| Indonesians | 0.1 /100 | #293 | Tragic $47,503 |