Croatian vs Cree Median Male Earnings
COMPARE
Croatian
Cree
Median Male Earnings
Median Male Earnings Comparison
Croatians
Cree
$59,715
MEDIAN MALE EARNINGS
99.4/ 100
METRIC RATING
82nd/ 347
METRIC RANK
$49,497
MEDIAN MALE EARNINGS
0.7/ 100
METRIC RATING
258th/ 347
METRIC RANK
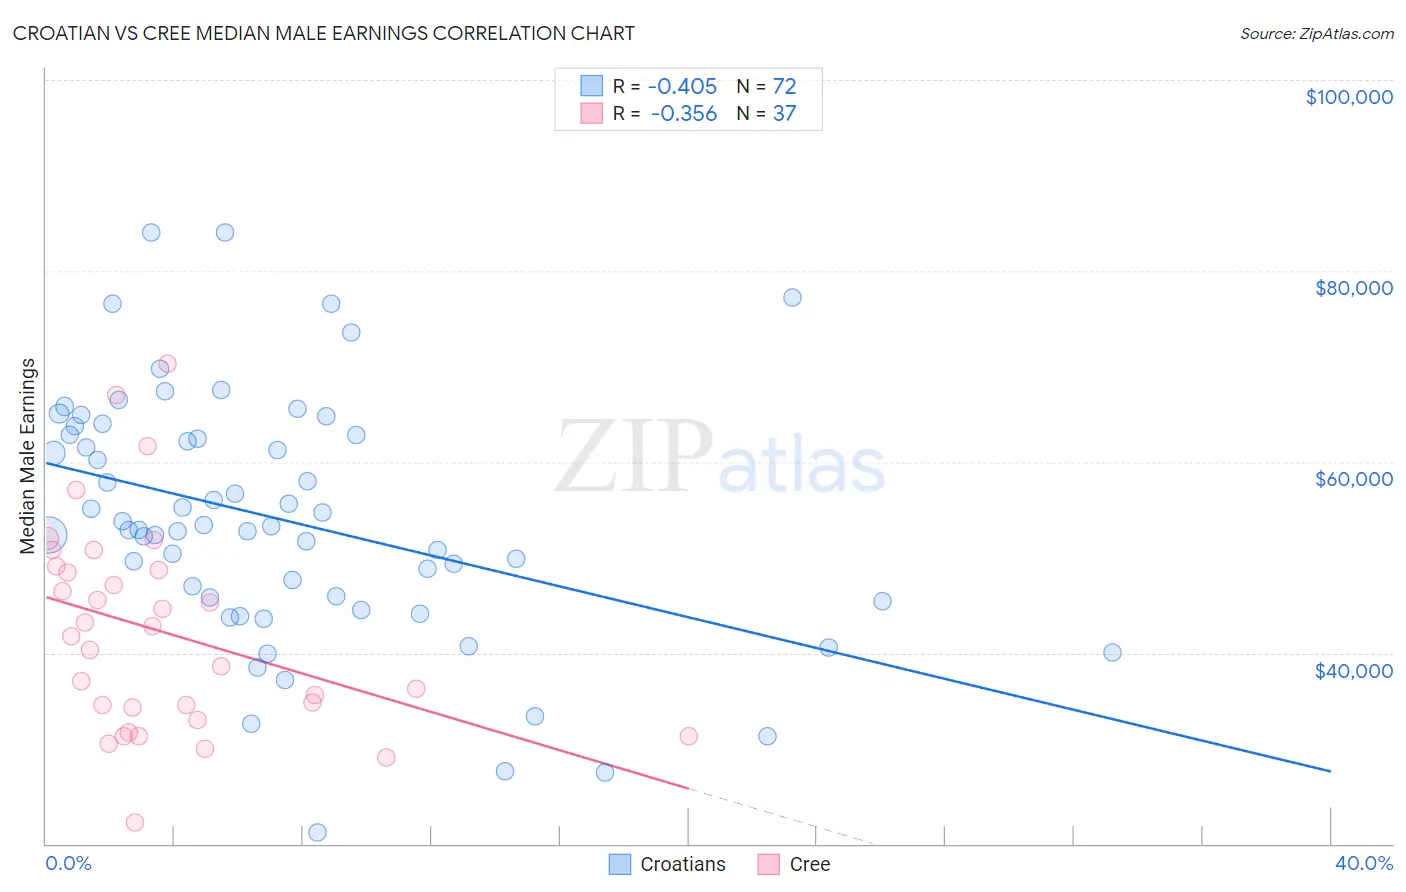
Croatian vs Cree Median Male Earnings Correlation Chart
The statistical analysis conducted on geographies consisting of 375,622,931 people shows a moderate negative correlation between the proportion of Croatians and median male earnings in the United States with a correlation coefficient (R) of -0.405 and weighted average of $59,715. Similarly, the statistical analysis conducted on geographies consisting of 76,198,776 people shows a mild negative correlation between the proportion of Cree and median male earnings in the United States with a correlation coefficient (R) of -0.356 and weighted average of $49,497, a difference of 20.6%.
Median Male Earnings Correlation Summary
| Measurement | Croatian | Cree |
| Minimum | $21,121 | $22,163 |
| Maximum | $84,044 | $70,294 |
| Range | $62,923 | $48,131 |
| Mean | $53,900 | $42,158 |
| Median | $53,037 | $41,730 |
| Interquartile 25% (IQ1) | $45,591 | $33,580 |
| Interquartile 75% (IQ3) | $62,805 | $48,892 |
| Interquartile Range (IQR) | $17,214 | $15,312 |
| Standard Deviation (Sample) | $12,980 | $10,951 |
| Standard Deviation (Population) | $12,890 | $10,802 |
Similar Demographics by Median Male Earnings
Demographics Similar to Croatians by Median Male Earnings
In terms of median male earnings, the demographic groups most similar to Croatians are Ukrainian ($59,728, a difference of 0.020%), Immigrants from Italy ($59,691, a difference of 0.040%), Immigrants from Hungary ($59,806, a difference of 0.15%), Immigrants from Ukraine ($59,820, a difference of 0.18%), and Afghan ($59,554, a difference of 0.27%).
| Demographics | Rating | Rank | Median Male Earnings |
| Immigrants | Bolivia | 99.6 /100 | #75 | Exceptional $60,088 |
| Romanians | 99.6 /100 | #76 | Exceptional $60,063 |
| Paraguayans | 99.5 /100 | #77 | Exceptional $59,975 |
| Immigrants | Egypt | 99.5 /100 | #78 | Exceptional $59,925 |
| Immigrants | Ukraine | 99.5 /100 | #79 | Exceptional $59,820 |
| Immigrants | Hungary | 99.5 /100 | #80 | Exceptional $59,806 |
| Ukrainians | 99.4 /100 | #81 | Exceptional $59,728 |
| Croatians | 99.4 /100 | #82 | Exceptional $59,715 |
| Immigrants | Italy | 99.4 /100 | #83 | Exceptional $59,691 |
| Afghans | 99.3 /100 | #84 | Exceptional $59,554 |
| Italians | 99.3 /100 | #85 | Exceptional $59,551 |
| Immigrants | England | 99.3 /100 | #86 | Exceptional $59,527 |
| Macedonians | 99.3 /100 | #87 | Exceptional $59,522 |
| Immigrants | Argentina | 99.3 /100 | #88 | Exceptional $59,491 |
| Immigrants | Moldova | 99.2 /100 | #89 | Exceptional $59,417 |
Demographics Similar to Cree by Median Male Earnings
In terms of median male earnings, the demographic groups most similar to Cree are Nepalese ($49,458, a difference of 0.080%), Iroquois ($49,374, a difference of 0.25%), British West Indian ($49,636, a difference of 0.28%), Liberian ($49,318, a difference of 0.36%), and Alaska Native ($49,711, a difference of 0.43%).
| Demographics | Rating | Rank | Median Male Earnings |
| Immigrants | Grenada | 1.6 /100 | #251 | Tragic $50,279 |
| Immigrants | Cabo Verde | 1.2 /100 | #252 | Tragic $50,009 |
| German Russians | 1.1 /100 | #253 | Tragic $49,924 |
| Senegalese | 1.0 /100 | #254 | Tragic $49,774 |
| Alaskan Athabascans | 0.9 /100 | #255 | Tragic $49,748 |
| Alaska Natives | 0.9 /100 | #256 | Tragic $49,711 |
| British West Indians | 0.8 /100 | #257 | Tragic $49,636 |
| Cree | 0.7 /100 | #258 | Tragic $49,497 |
| Nepalese | 0.7 /100 | #259 | Tragic $49,458 |
| Iroquois | 0.7 /100 | #260 | Tragic $49,374 |
| Liberians | 0.6 /100 | #261 | Tragic $49,318 |
| Immigrants | West Indies | 0.6 /100 | #262 | Tragic $49,271 |
| Nicaraguans | 0.6 /100 | #263 | Tragic $49,215 |
| Immigrants | Middle Africa | 0.6 /100 | #264 | Tragic $49,201 |
| Immigrants | Laos | 0.6 /100 | #265 | Tragic $49,190 |