Croatian vs Immigrants from Hungary Median Male Earnings
COMPARE
Croatian
Immigrants from Hungary
Median Male Earnings
Median Male Earnings Comparison
Croatians
Immigrants from Hungary
$59,715
MEDIAN MALE EARNINGS
99.4/ 100
METRIC RATING
82nd/ 347
METRIC RANK
$59,806
MEDIAN MALE EARNINGS
99.5/ 100
METRIC RATING
80th/ 347
METRIC RANK
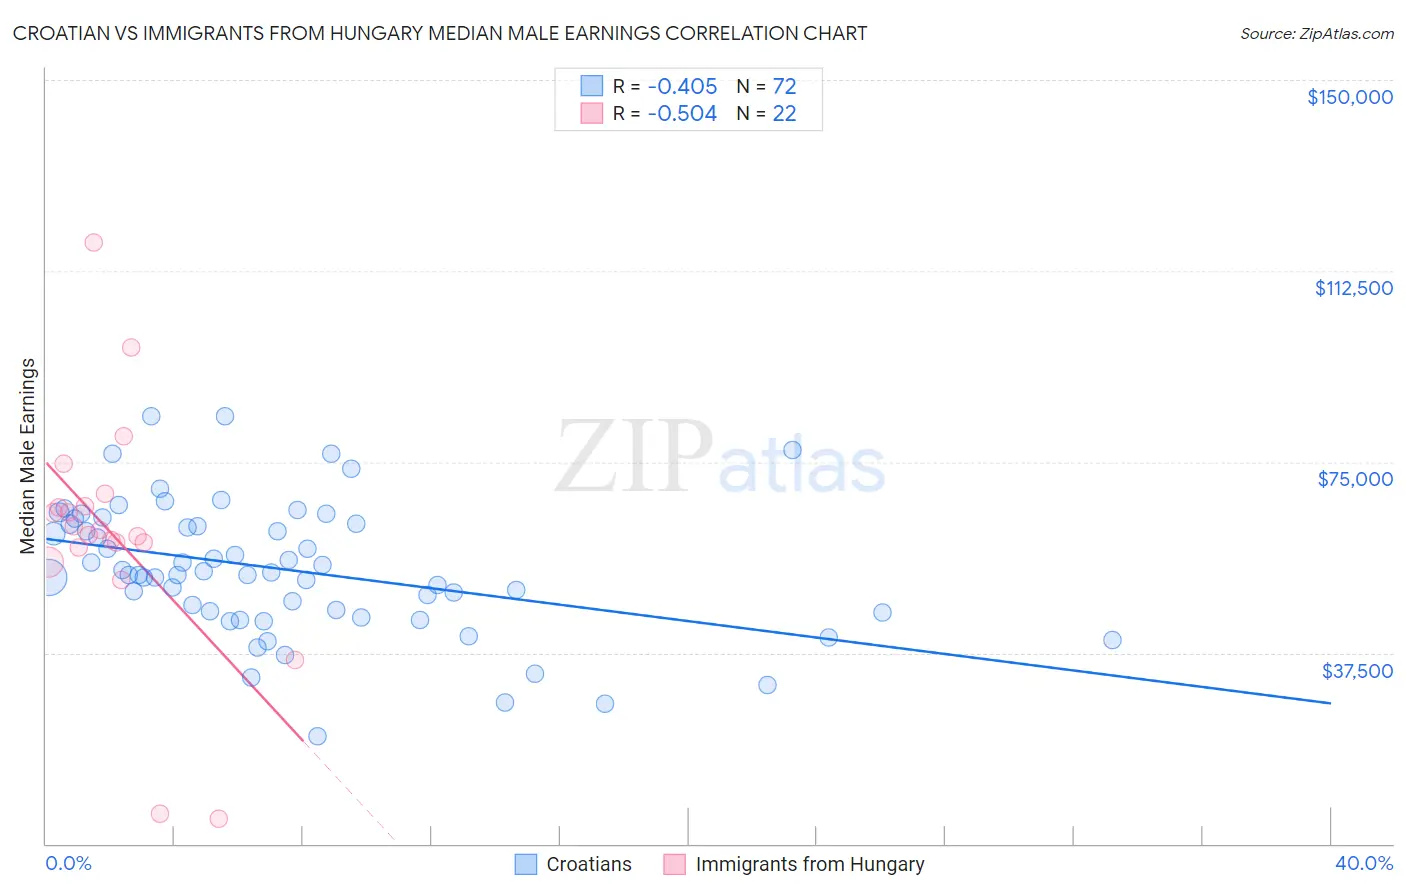
Croatian vs Immigrants from Hungary Median Male Earnings Correlation Chart
The statistical analysis conducted on geographies consisting of 375,622,931 people shows a moderate negative correlation between the proportion of Croatians and median male earnings in the United States with a correlation coefficient (R) of -0.405 and weighted average of $59,715. Similarly, the statistical analysis conducted on geographies consisting of 195,676,338 people shows a substantial negative correlation between the proportion of Immigrants from Hungary and median male earnings in the United States with a correlation coefficient (R) of -0.504 and weighted average of $59,806, a difference of 0.15%.
Median Male Earnings Correlation Summary
| Measurement | Croatian | Immigrants from Hungary |
| Minimum | $21,121 | $4,861 |
| Maximum | $84,044 | $118,099 |
| Range | $62,923 | $113,238 |
| Mean | $53,900 | $60,734 |
| Median | $53,037 | $61,103 |
| Interquartile 25% (IQ1) | $45,591 | $58,200 |
| Interquartile 75% (IQ3) | $62,805 | $66,315 |
| Interquartile Range (IQR) | $17,214 | $8,115 |
| Standard Deviation (Sample) | $12,980 | $24,141 |
| Standard Deviation (Population) | $12,890 | $23,586 |
Demographics Similar to Croatians and Immigrants from Hungary by Median Male Earnings
In terms of median male earnings, the demographic groups most similar to Croatians are Ukrainian ($59,728, a difference of 0.020%), Immigrants from Italy ($59,691, a difference of 0.040%), Immigrants from Ukraine ($59,820, a difference of 0.18%), Afghan ($59,554, a difference of 0.27%), and Italian ($59,551, a difference of 0.27%). Similarly, the demographic groups most similar to Immigrants from Hungary are Immigrants from Ukraine ($59,820, a difference of 0.020%), Ukrainian ($59,728, a difference of 0.13%), Immigrants from Italy ($59,691, a difference of 0.19%), Immigrants from Egypt ($59,925, a difference of 0.20%), and Paraguayan ($59,975, a difference of 0.28%).
| Demographics | Rating | Rank | Median Male Earnings |
| Mongolians | 99.7 /100 | #71 | Exceptional $60,350 |
| Immigrants | Western Europe | 99.7 /100 | #72 | Exceptional $60,334 |
| Immigrants | North America | 99.7 /100 | #73 | Exceptional $60,265 |
| Argentineans | 99.6 /100 | #74 | Exceptional $60,117 |
| Immigrants | Bolivia | 99.6 /100 | #75 | Exceptional $60,088 |
| Romanians | 99.6 /100 | #76 | Exceptional $60,063 |
| Paraguayans | 99.5 /100 | #77 | Exceptional $59,975 |
| Immigrants | Egypt | 99.5 /100 | #78 | Exceptional $59,925 |
| Immigrants | Ukraine | 99.5 /100 | #79 | Exceptional $59,820 |
| Immigrants | Hungary | 99.5 /100 | #80 | Exceptional $59,806 |
| Ukrainians | 99.4 /100 | #81 | Exceptional $59,728 |
| Croatians | 99.4 /100 | #82 | Exceptional $59,715 |
| Immigrants | Italy | 99.4 /100 | #83 | Exceptional $59,691 |
| Afghans | 99.3 /100 | #84 | Exceptional $59,554 |
| Italians | 99.3 /100 | #85 | Exceptional $59,551 |
| Immigrants | England | 99.3 /100 | #86 | Exceptional $59,527 |
| Macedonians | 99.3 /100 | #87 | Exceptional $59,522 |
| Immigrants | Argentina | 99.3 /100 | #88 | Exceptional $59,491 |
| Immigrants | Moldova | 99.2 /100 | #89 | Exceptional $59,417 |
| Austrians | 99.2 /100 | #90 | Exceptional $59,359 |
| Laotians | 99.2 /100 | #91 | Exceptional $59,351 |