Croatian vs Immigrants from Honduras Median Male Earnings
COMPARE
Croatian
Immigrants from Honduras
Median Male Earnings
Median Male Earnings Comparison
Croatians
Immigrants from Honduras
$59,715
MEDIAN MALE EARNINGS
99.4/ 100
METRIC RATING
82nd/ 347
METRIC RANK
$45,787
MEDIAN MALE EARNINGS
0.0/ 100
METRIC RATING
320th/ 347
METRIC RANK
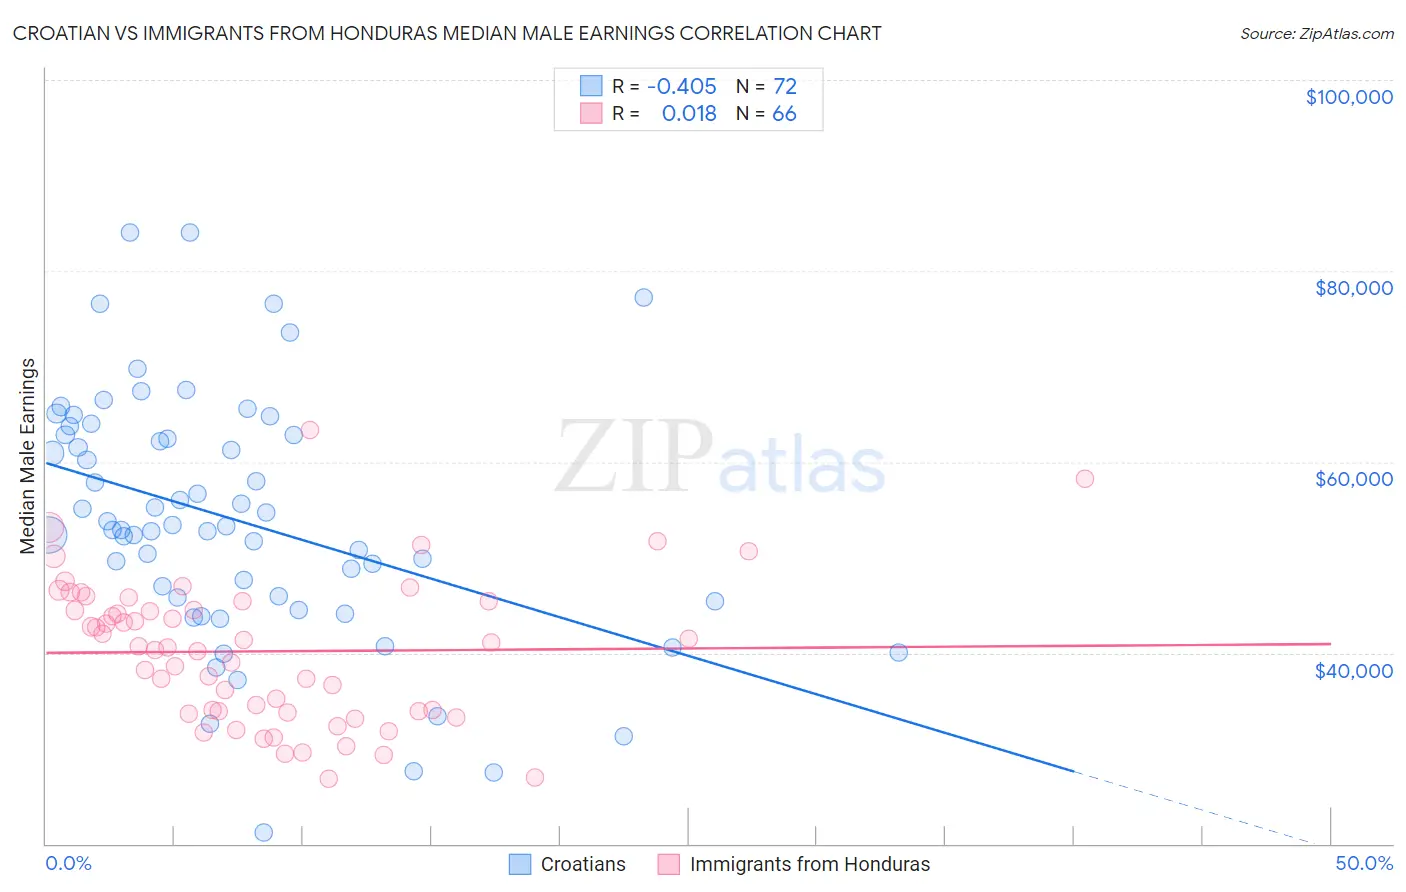
Croatian vs Immigrants from Honduras Median Male Earnings Correlation Chart
The statistical analysis conducted on geographies consisting of 375,622,931 people shows a moderate negative correlation between the proportion of Croatians and median male earnings in the United States with a correlation coefficient (R) of -0.405 and weighted average of $59,715. Similarly, the statistical analysis conducted on geographies consisting of 322,554,949 people shows no correlation between the proportion of Immigrants from Honduras and median male earnings in the United States with a correlation coefficient (R) of 0.018 and weighted average of $45,787, a difference of 30.4%.
Median Male Earnings Correlation Summary
| Measurement | Croatian | Immigrants from Honduras |
| Minimum | $21,121 | $26,786 |
| Maximum | $84,044 | $63,286 |
| Range | $62,923 | $36,500 |
| Mean | $53,900 | $40,153 |
| Median | $53,037 | $40,629 |
| Interquartile 25% (IQ1) | $45,591 | $33,830 |
| Interquartile 75% (IQ3) | $62,805 | $45,376 |
| Interquartile Range (IQR) | $17,214 | $11,546 |
| Standard Deviation (Sample) | $12,980 | $7,556 |
| Standard Deviation (Population) | $12,890 | $7,498 |
Similar Demographics by Median Male Earnings
Demographics Similar to Croatians by Median Male Earnings
In terms of median male earnings, the demographic groups most similar to Croatians are Ukrainian ($59,728, a difference of 0.020%), Immigrants from Italy ($59,691, a difference of 0.040%), Immigrants from Hungary ($59,806, a difference of 0.15%), Immigrants from Ukraine ($59,820, a difference of 0.18%), and Afghan ($59,554, a difference of 0.27%).
| Demographics | Rating | Rank | Median Male Earnings |
| Immigrants | Bolivia | 99.6 /100 | #75 | Exceptional $60,088 |
| Romanians | 99.6 /100 | #76 | Exceptional $60,063 |
| Paraguayans | 99.5 /100 | #77 | Exceptional $59,975 |
| Immigrants | Egypt | 99.5 /100 | #78 | Exceptional $59,925 |
| Immigrants | Ukraine | 99.5 /100 | #79 | Exceptional $59,820 |
| Immigrants | Hungary | 99.5 /100 | #80 | Exceptional $59,806 |
| Ukrainians | 99.4 /100 | #81 | Exceptional $59,728 |
| Croatians | 99.4 /100 | #82 | Exceptional $59,715 |
| Immigrants | Italy | 99.4 /100 | #83 | Exceptional $59,691 |
| Afghans | 99.3 /100 | #84 | Exceptional $59,554 |
| Italians | 99.3 /100 | #85 | Exceptional $59,551 |
| Immigrants | England | 99.3 /100 | #86 | Exceptional $59,527 |
| Macedonians | 99.3 /100 | #87 | Exceptional $59,522 |
| Immigrants | Argentina | 99.3 /100 | #88 | Exceptional $59,491 |
| Immigrants | Moldova | 99.2 /100 | #89 | Exceptional $59,417 |
Demographics Similar to Immigrants from Honduras by Median Male Earnings
In terms of median male earnings, the demographic groups most similar to Immigrants from Honduras are Haitian ($45,903, a difference of 0.25%), Fijian ($45,607, a difference of 0.39%), Sioux ($45,566, a difference of 0.48%), Immigrants from Central America ($45,538, a difference of 0.55%), and Black/African American ($45,523, a difference of 0.58%).
| Demographics | Rating | Rank | Median Male Earnings |
| Hondurans | 0.0 /100 | #313 | Tragic $46,374 |
| Chippewa | 0.0 /100 | #314 | Tragic $46,368 |
| Immigrants | Guatemala | 0.0 /100 | #315 | Tragic $46,244 |
| Immigrants | Caribbean | 0.0 /100 | #316 | Tragic $46,193 |
| Mexicans | 0.0 /100 | #317 | Tragic $46,147 |
| Cheyenne | 0.0 /100 | #318 | Tragic $46,062 |
| Haitians | 0.0 /100 | #319 | Tragic $45,903 |
| Immigrants | Honduras | 0.0 /100 | #320 | Tragic $45,787 |
| Fijians | 0.0 /100 | #321 | Tragic $45,607 |
| Sioux | 0.0 /100 | #322 | Tragic $45,566 |
| Immigrants | Central America | 0.0 /100 | #323 | Tragic $45,538 |
| Blacks/African Americans | 0.0 /100 | #324 | Tragic $45,523 |
| Yuman | 0.0 /100 | #325 | Tragic $45,446 |
| Immigrants | Haiti | 0.0 /100 | #326 | Tragic $45,266 |
| Immigrants | Bahamas | 0.0 /100 | #327 | Tragic $45,176 |