Croatian vs Immigrants from Congo Median Male Earnings
COMPARE
Croatian
Immigrants from Congo
Median Male Earnings
Median Male Earnings Comparison
Croatians
Immigrants from Congo
$59,715
MEDIAN MALE EARNINGS
99.4/ 100
METRIC RATING
82nd/ 347
METRIC RANK
$44,204
MEDIAN MALE EARNINGS
0.0/ 100
METRIC RATING
333rd/ 347
METRIC RANK
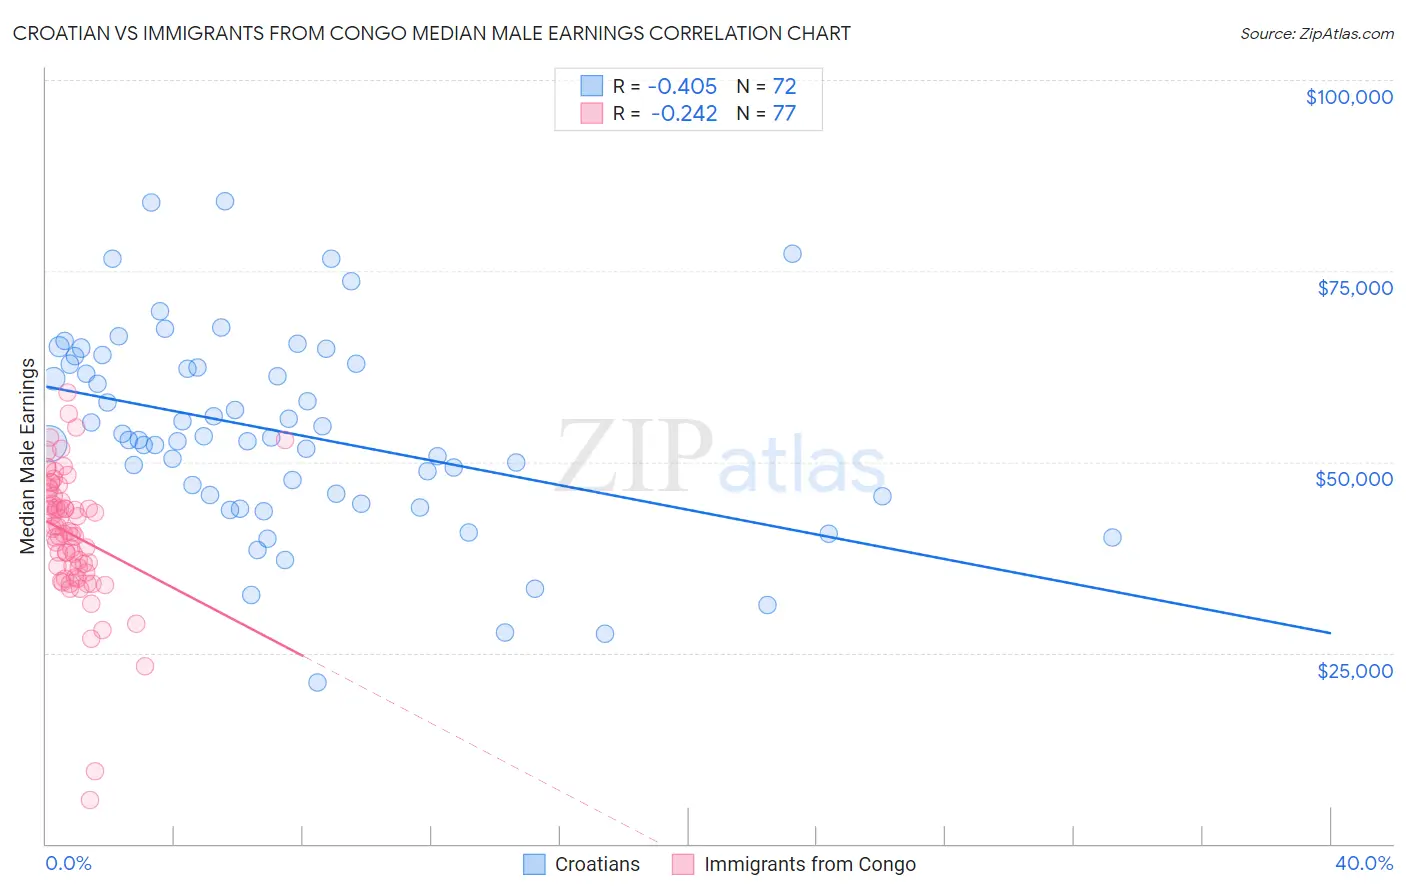
Croatian vs Immigrants from Congo Median Male Earnings Correlation Chart
The statistical analysis conducted on geographies consisting of 375,622,931 people shows a moderate negative correlation between the proportion of Croatians and median male earnings in the United States with a correlation coefficient (R) of -0.405 and weighted average of $59,715. Similarly, the statistical analysis conducted on geographies consisting of 92,117,161 people shows a weak negative correlation between the proportion of Immigrants from Congo and median male earnings in the United States with a correlation coefficient (R) of -0.242 and weighted average of $44,204, a difference of 35.1%.
Median Male Earnings Correlation Summary
| Measurement | Croatian | Immigrants from Congo |
| Minimum | $21,121 | $5,667 |
| Maximum | $84,044 | $59,021 |
| Range | $62,923 | $53,354 |
| Mean | $53,900 | $40,451 |
| Median | $53,037 | $40,971 |
| Interquartile 25% (IQ1) | $45,591 | $35,851 |
| Interquartile 75% (IQ3) | $62,805 | $45,724 |
| Interquartile Range (IQR) | $17,214 | $9,873 |
| Standard Deviation (Sample) | $12,980 | $8,754 |
| Standard Deviation (Population) | $12,890 | $8,697 |
Similar Demographics by Median Male Earnings
Demographics Similar to Croatians by Median Male Earnings
In terms of median male earnings, the demographic groups most similar to Croatians are Ukrainian ($59,728, a difference of 0.020%), Immigrants from Italy ($59,691, a difference of 0.040%), Immigrants from Hungary ($59,806, a difference of 0.15%), Immigrants from Ukraine ($59,820, a difference of 0.18%), and Afghan ($59,554, a difference of 0.27%).
| Demographics | Rating | Rank | Median Male Earnings |
| Immigrants | Bolivia | 99.6 /100 | #75 | Exceptional $60,088 |
| Romanians | 99.6 /100 | #76 | Exceptional $60,063 |
| Paraguayans | 99.5 /100 | #77 | Exceptional $59,975 |
| Immigrants | Egypt | 99.5 /100 | #78 | Exceptional $59,925 |
| Immigrants | Ukraine | 99.5 /100 | #79 | Exceptional $59,820 |
| Immigrants | Hungary | 99.5 /100 | #80 | Exceptional $59,806 |
| Ukrainians | 99.4 /100 | #81 | Exceptional $59,728 |
| Croatians | 99.4 /100 | #82 | Exceptional $59,715 |
| Immigrants | Italy | 99.4 /100 | #83 | Exceptional $59,691 |
| Afghans | 99.3 /100 | #84 | Exceptional $59,554 |
| Italians | 99.3 /100 | #85 | Exceptional $59,551 |
| Immigrants | England | 99.3 /100 | #86 | Exceptional $59,527 |
| Macedonians | 99.3 /100 | #87 | Exceptional $59,522 |
| Immigrants | Argentina | 99.3 /100 | #88 | Exceptional $59,491 |
| Immigrants | Moldova | 99.2 /100 | #89 | Exceptional $59,417 |
Demographics Similar to Immigrants from Congo by Median Male Earnings
In terms of median male earnings, the demographic groups most similar to Immigrants from Congo are Immigrants from Yemen ($44,083, a difference of 0.27%), Spanish American Indian ($44,010, a difference of 0.44%), Bahamian ($44,756, a difference of 1.3%), Native/Alaskan ($44,775, a difference of 1.3%), and Immigrants from Mexico ($44,960, a difference of 1.7%).
| Demographics | Rating | Rank | Median Male Earnings |
| Immigrants | Haiti | 0.0 /100 | #326 | Tragic $45,266 |
| Immigrants | Bahamas | 0.0 /100 | #327 | Tragic $45,176 |
| Kiowa | 0.0 /100 | #328 | Tragic $45,094 |
| Yakama | 0.0 /100 | #329 | Tragic $45,002 |
| Immigrants | Mexico | 0.0 /100 | #330 | Tragic $44,960 |
| Natives/Alaskans | 0.0 /100 | #331 | Tragic $44,775 |
| Bahamians | 0.0 /100 | #332 | Tragic $44,756 |
| Immigrants | Congo | 0.0 /100 | #333 | Tragic $44,204 |
| Immigrants | Yemen | 0.0 /100 | #334 | Tragic $44,083 |
| Spanish American Indians | 0.0 /100 | #335 | Tragic $44,010 |
| Immigrants | Cuba | 0.0 /100 | #336 | Tragic $43,461 |
| Menominee | 0.0 /100 | #337 | Tragic $42,581 |
| Crow | 0.0 /100 | #338 | Tragic $42,434 |
| Pima | 0.0 /100 | #339 | Tragic $42,357 |
| Navajo | 0.0 /100 | #340 | Tragic $42,098 |