Creek vs Czechoslovakian Median Family Income
COMPARE
Creek
Czechoslovakian
Median Family Income
Median Family Income Comparison
Creek
Czechoslovakians
$82,560
MEDIAN FAMILY INCOME
0.0/ 100
METRIC RATING
324th/ 347
METRIC RANK
$103,273
MEDIAN FAMILY INCOME
57.6/ 100
METRIC RATING
169th/ 347
METRIC RANK
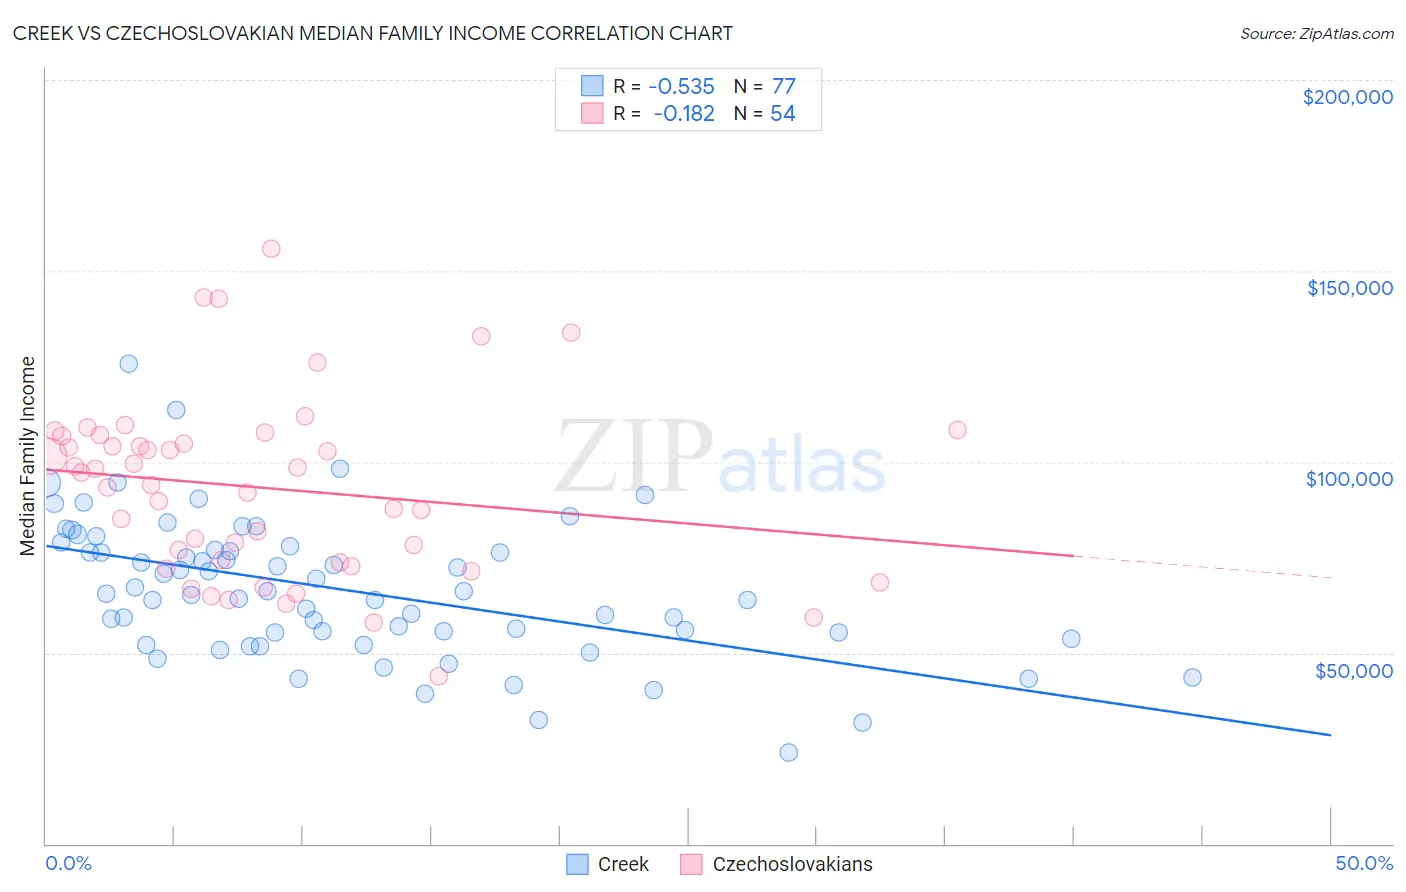
Creek vs Czechoslovakian Median Family Income Correlation Chart
The statistical analysis conducted on geographies consisting of 178,420,625 people shows a substantial negative correlation between the proportion of Creek and median family income in the United States with a correlation coefficient (R) of -0.535 and weighted average of $82,560. Similarly, the statistical analysis conducted on geographies consisting of 368,451,092 people shows a poor negative correlation between the proportion of Czechoslovakians and median family income in the United States with a correlation coefficient (R) of -0.182 and weighted average of $103,273, a difference of 25.1%.
Median Family Income Correlation Summary
| Measurement | Creek | Czechoslovakian |
| Minimum | $23,750 | $43,750 |
| Maximum | $125,671 | $155,917 |
| Range | $101,921 | $112,167 |
| Mean | $66,532 | $93,173 |
| Median | $65,440 | $95,488 |
| Interquartile 25% (IQ1) | $54,458 | $73,511 |
| Interquartile 75% (IQ3) | $77,450 | $106,731 |
| Interquartile Range (IQR) | $22,992 | $33,220 |
| Standard Deviation (Sample) | $18,322 | $23,604 |
| Standard Deviation (Population) | $18,202 | $23,385 |
Similar Demographics by Median Family Income
Demographics Similar to Creek by Median Family Income
In terms of median family income, the demographic groups most similar to Creek are Bahamian ($82,631, a difference of 0.090%), Sioux ($82,386, a difference of 0.21%), Dominican ($82,888, a difference of 0.40%), Immigrants from Congo ($82,216, a difference of 0.42%), and Arapaho ($82,064, a difference of 0.61%).
| Demographics | Rating | Rank | Median Family Income |
| Yakama | 0.0 /100 | #317 | Tragic $83,932 |
| Immigrants | Mexico | 0.0 /100 | #318 | Tragic $83,639 |
| Immigrants | Honduras | 0.0 /100 | #319 | Tragic $83,618 |
| Seminole | 0.0 /100 | #320 | Tragic $83,354 |
| Immigrants | Caribbean | 0.0 /100 | #321 | Tragic $83,319 |
| Dominicans | 0.0 /100 | #322 | Tragic $82,888 |
| Bahamians | 0.0 /100 | #323 | Tragic $82,631 |
| Creek | 0.0 /100 | #324 | Tragic $82,560 |
| Sioux | 0.0 /100 | #325 | Tragic $82,386 |
| Immigrants | Congo | 0.0 /100 | #326 | Tragic $82,216 |
| Arapaho | 0.0 /100 | #327 | Tragic $82,064 |
| Blacks/African Americans | 0.0 /100 | #328 | Tragic $81,912 |
| Dutch West Indians | 0.0 /100 | #329 | Tragic $81,852 |
| Cheyenne | 0.0 /100 | #330 | Tragic $81,385 |
| Immigrants | Dominican Republic | 0.0 /100 | #331 | Tragic $81,233 |
Demographics Similar to Czechoslovakians by Median Family Income
In terms of median family income, the demographic groups most similar to Czechoslovakians are Immigrants from Uzbekistan ($103,197, a difference of 0.070%), Immigrants from Peru ($103,534, a difference of 0.25%), Alsatian ($103,010, a difference of 0.26%), South American Indian ($103,624, a difference of 0.34%), and English ($103,684, a difference of 0.40%).
| Demographics | Rating | Rank | Median Family Income |
| Immigrants | Sierra Leone | 66.2 /100 | #162 | Good $103,990 |
| Costa Ricans | 66.2 /100 | #163 | Good $103,989 |
| Sierra Leoneans | 64.7 /100 | #164 | Good $103,859 |
| Slovaks | 63.1 /100 | #165 | Good $103,729 |
| English | 62.6 /100 | #166 | Good $103,684 |
| South American Indians | 61.9 /100 | #167 | Good $103,624 |
| Immigrants | Peru | 60.8 /100 | #168 | Good $103,534 |
| Czechoslovakians | 57.6 /100 | #169 | Average $103,273 |
| Immigrants | Uzbekistan | 56.6 /100 | #170 | Average $103,197 |
| Alsatians | 54.3 /100 | #171 | Average $103,010 |
| Immigrants | Eritrea | 51.9 /100 | #172 | Average $102,823 |
| Belgians | 51.4 /100 | #173 | Average $102,788 |
| Finns | 50.0 /100 | #174 | Average $102,676 |
| Immigrants | Eastern Africa | 47.1 /100 | #175 | Average $102,451 |
| French | 46.1 /100 | #176 | Average $102,368 |