Creek vs Hispanic or Latino Median Family Income
COMPARE
Creek
Hispanic or Latino
Median Family Income
Median Family Income Comparison
Creek
Hispanics or Latinos
$82,560
MEDIAN FAMILY INCOME
0.0/ 100
METRIC RATING
324th/ 347
METRIC RANK
$85,647
MEDIAN FAMILY INCOME
0.0/ 100
METRIC RATING
303rd/ 347
METRIC RANK
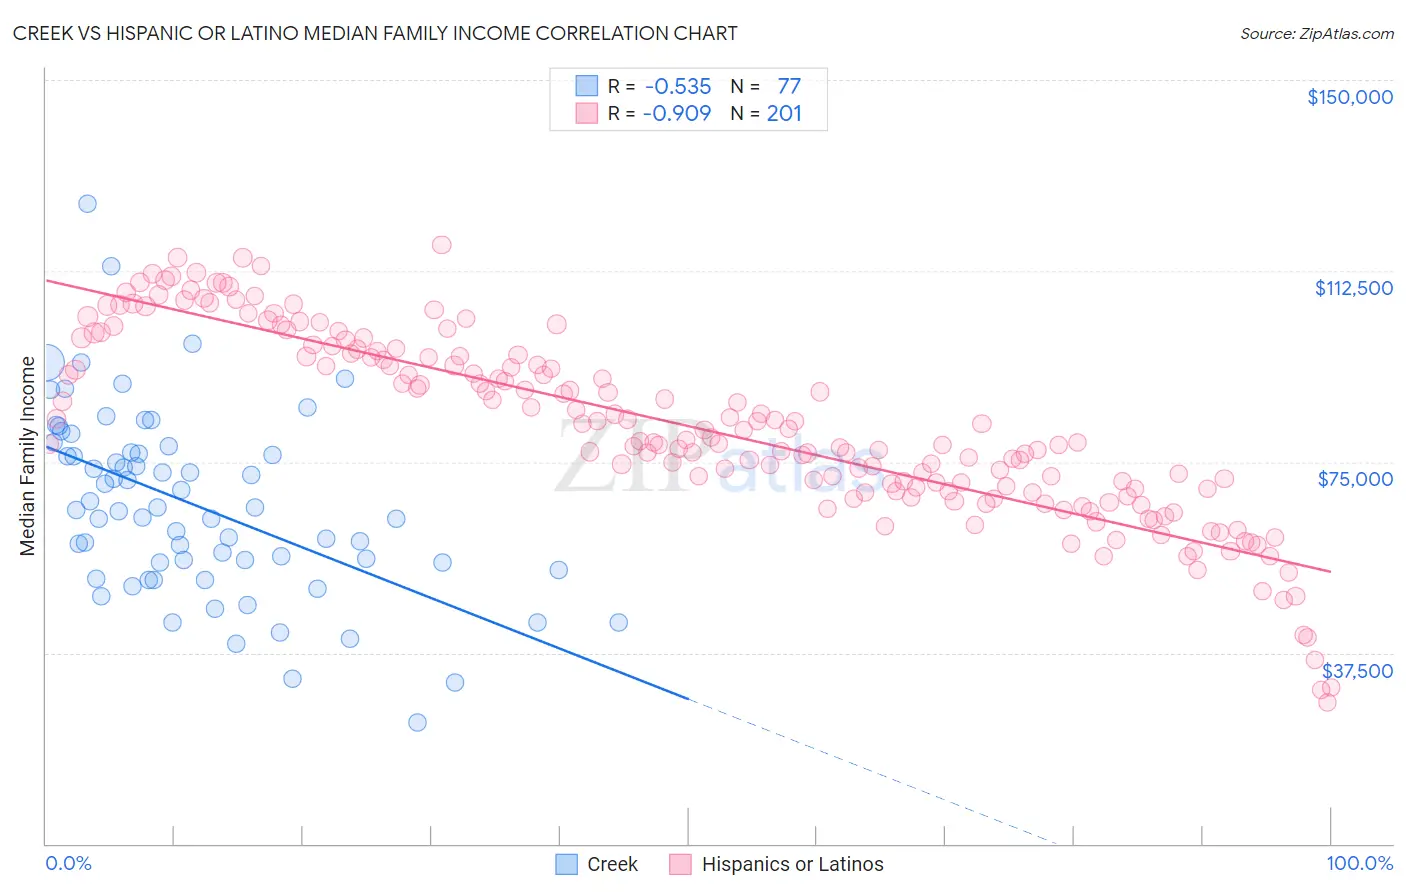
Creek vs Hispanic or Latino Median Family Income Correlation Chart
The statistical analysis conducted on geographies consisting of 178,420,625 people shows a substantial negative correlation between the proportion of Creek and median family income in the United States with a correlation coefficient (R) of -0.535 and weighted average of $82,560. Similarly, the statistical analysis conducted on geographies consisting of 576,861,643 people shows a near-perfect negative correlation between the proportion of Hispanics or Latinos and median family income in the United States with a correlation coefficient (R) of -0.909 and weighted average of $85,647, a difference of 3.7%.
Median Family Income Correlation Summary
| Measurement | Creek | Hispanic or Latino |
| Minimum | $23,750 | $27,753 |
| Maximum | $125,671 | $117,566 |
| Range | $101,921 | $89,813 |
| Mean | $66,532 | $81,882 |
| Median | $65,440 | $79,837 |
| Interquartile 25% (IQ1) | $54,458 | $69,539 |
| Interquartile 75% (IQ3) | $77,450 | $96,180 |
| Interquartile Range (IQR) | $22,992 | $26,641 |
| Standard Deviation (Sample) | $18,322 | $18,312 |
| Standard Deviation (Population) | $18,202 | $18,267 |
Similar Demographics by Median Family Income
Demographics Similar to Creek by Median Family Income
In terms of median family income, the demographic groups most similar to Creek are Bahamian ($82,631, a difference of 0.090%), Sioux ($82,386, a difference of 0.21%), Dominican ($82,888, a difference of 0.40%), Immigrants from Congo ($82,216, a difference of 0.42%), and Arapaho ($82,064, a difference of 0.61%).
| Demographics | Rating | Rank | Median Family Income |
| Yakama | 0.0 /100 | #317 | Tragic $83,932 |
| Immigrants | Mexico | 0.0 /100 | #318 | Tragic $83,639 |
| Immigrants | Honduras | 0.0 /100 | #319 | Tragic $83,618 |
| Seminole | 0.0 /100 | #320 | Tragic $83,354 |
| Immigrants | Caribbean | 0.0 /100 | #321 | Tragic $83,319 |
| Dominicans | 0.0 /100 | #322 | Tragic $82,888 |
| Bahamians | 0.0 /100 | #323 | Tragic $82,631 |
| Creek | 0.0 /100 | #324 | Tragic $82,560 |
| Sioux | 0.0 /100 | #325 | Tragic $82,386 |
| Immigrants | Congo | 0.0 /100 | #326 | Tragic $82,216 |
| Arapaho | 0.0 /100 | #327 | Tragic $82,064 |
| Blacks/African Americans | 0.0 /100 | #328 | Tragic $81,912 |
| Dutch West Indians | 0.0 /100 | #329 | Tragic $81,852 |
| Cheyenne | 0.0 /100 | #330 | Tragic $81,385 |
| Immigrants | Dominican Republic | 0.0 /100 | #331 | Tragic $81,233 |
Demographics Similar to Hispanics or Latinos by Median Family Income
In terms of median family income, the demographic groups most similar to Hispanics or Latinos are Mexican ($85,618, a difference of 0.030%), Spanish American Indian ($85,728, a difference of 0.090%), Colville ($85,792, a difference of 0.17%), Paiute ($85,414, a difference of 0.27%), and Immigrants from Dominica ($85,411, a difference of 0.28%).
| Demographics | Rating | Rank | Median Family Income |
| Immigrants | Guatemala | 0.0 /100 | #296 | Tragic $87,191 |
| Cajuns | 0.0 /100 | #297 | Tragic $87,157 |
| Immigrants | Latin America | 0.0 /100 | #298 | Tragic $86,989 |
| Chippewa | 0.0 /100 | #299 | Tragic $86,852 |
| Ottawa | 0.0 /100 | #300 | Tragic $86,380 |
| Colville | 0.0 /100 | #301 | Tragic $85,792 |
| Spanish American Indians | 0.0 /100 | #302 | Tragic $85,728 |
| Hispanics or Latinos | 0.0 /100 | #303 | Tragic $85,647 |
| Mexicans | 0.0 /100 | #304 | Tragic $85,618 |
| Paiute | 0.0 /100 | #305 | Tragic $85,414 |
| Immigrants | Dominica | 0.0 /100 | #306 | Tragic $85,411 |
| Chickasaw | 0.0 /100 | #307 | Tragic $85,356 |
| U.S. Virgin Islanders | 0.0 /100 | #308 | Tragic $85,294 |
| Haitians | 0.0 /100 | #309 | Tragic $85,218 |
| Immigrants | Central America | 0.0 /100 | #310 | Tragic $85,050 |