Creek vs Mexican American Indian Median Family Income
COMPARE
Creek
Mexican American Indian
Median Family Income
Median Family Income Comparison
Creek
Mexican American Indians
$82,560
MEDIAN FAMILY INCOME
0.0/ 100
METRIC RATING
324th/ 347
METRIC RANK
$90,918
MEDIAN FAMILY INCOME
0.2/ 100
METRIC RATING
267th/ 347
METRIC RANK
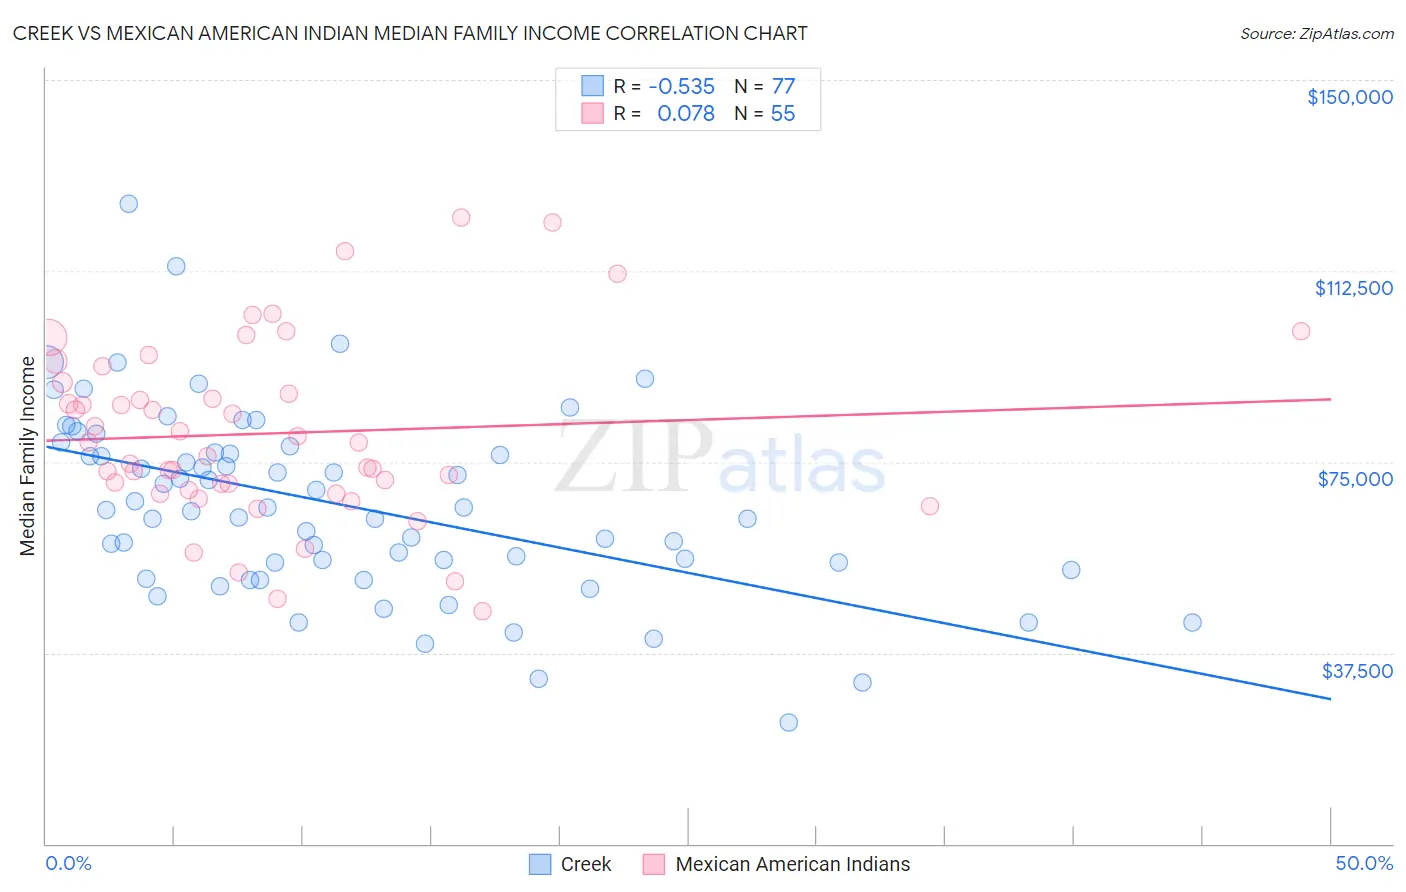
Creek vs Mexican American Indian Median Family Income Correlation Chart
The statistical analysis conducted on geographies consisting of 178,420,625 people shows a substantial negative correlation between the proportion of Creek and median family income in the United States with a correlation coefficient (R) of -0.535 and weighted average of $82,560. Similarly, the statistical analysis conducted on geographies consisting of 317,461,685 people shows a slight positive correlation between the proportion of Mexican American Indians and median family income in the United States with a correlation coefficient (R) of 0.078 and weighted average of $90,918, a difference of 10.1%.
Median Family Income Correlation Summary
| Measurement | Creek | Mexican American Indian |
| Minimum | $23,750 | $45,568 |
| Maximum | $125,671 | $122,917 |
| Range | $101,921 | $77,349 |
| Mean | $66,532 | $80,601 |
| Median | $65,440 | $78,819 |
| Interquartile 25% (IQ1) | $54,458 | $69,567 |
| Interquartile 75% (IQ3) | $77,450 | $90,530 |
| Interquartile Range (IQR) | $22,992 | $20,964 |
| Standard Deviation (Sample) | $18,322 | $17,524 |
| Standard Deviation (Population) | $18,202 | $17,364 |
Similar Demographics by Median Family Income
Demographics Similar to Creek by Median Family Income
In terms of median family income, the demographic groups most similar to Creek are Bahamian ($82,631, a difference of 0.090%), Sioux ($82,386, a difference of 0.21%), Dominican ($82,888, a difference of 0.40%), Immigrants from Congo ($82,216, a difference of 0.42%), and Arapaho ($82,064, a difference of 0.61%).
| Demographics | Rating | Rank | Median Family Income |
| Yakama | 0.0 /100 | #317 | Tragic $83,932 |
| Immigrants | Mexico | 0.0 /100 | #318 | Tragic $83,639 |
| Immigrants | Honduras | 0.0 /100 | #319 | Tragic $83,618 |
| Seminole | 0.0 /100 | #320 | Tragic $83,354 |
| Immigrants | Caribbean | 0.0 /100 | #321 | Tragic $83,319 |
| Dominicans | 0.0 /100 | #322 | Tragic $82,888 |
| Bahamians | 0.0 /100 | #323 | Tragic $82,631 |
| Creek | 0.0 /100 | #324 | Tragic $82,560 |
| Sioux | 0.0 /100 | #325 | Tragic $82,386 |
| Immigrants | Congo | 0.0 /100 | #326 | Tragic $82,216 |
| Arapaho | 0.0 /100 | #327 | Tragic $82,064 |
| Blacks/African Americans | 0.0 /100 | #328 | Tragic $81,912 |
| Dutch West Indians | 0.0 /100 | #329 | Tragic $81,852 |
| Cheyenne | 0.0 /100 | #330 | Tragic $81,385 |
| Immigrants | Dominican Republic | 0.0 /100 | #331 | Tragic $81,233 |
Demographics Similar to Mexican American Indians by Median Family Income
In terms of median family income, the demographic groups most similar to Mexican American Indians are Cree ($90,882, a difference of 0.040%), Belizean ($90,880, a difference of 0.040%), Central American ($91,087, a difference of 0.19%), Jamaican ($90,581, a difference of 0.37%), and Iroquois ($90,543, a difference of 0.41%).
| Demographics | Rating | Rank | Median Family Income |
| Pennsylvania Germans | 0.4 /100 | #260 | Tragic $91,763 |
| Inupiat | 0.4 /100 | #261 | Tragic $91,730 |
| Liberians | 0.4 /100 | #262 | Tragic $91,722 |
| Immigrants | West Indies | 0.3 /100 | #263 | Tragic $91,588 |
| Senegalese | 0.3 /100 | #264 | Tragic $91,475 |
| Hmong | 0.3 /100 | #265 | Tragic $91,296 |
| Central Americans | 0.3 /100 | #266 | Tragic $91,087 |
| Mexican American Indians | 0.2 /100 | #267 | Tragic $90,918 |
| Cree | 0.2 /100 | #268 | Tragic $90,882 |
| Belizeans | 0.2 /100 | #269 | Tragic $90,880 |
| Jamaicans | 0.2 /100 | #270 | Tragic $90,581 |
| Iroquois | 0.2 /100 | #271 | Tragic $90,543 |
| Immigrants | Liberia | 0.2 /100 | #272 | Tragic $90,450 |
| Immigrants | Micronesia | 0.2 /100 | #273 | Tragic $90,345 |
| Spanish Americans | 0.2 /100 | #274 | Tragic $90,322 |