Creek vs Immigrants from Korea Median Family Income
COMPARE
Creek
Immigrants from Korea
Median Family Income
Median Family Income Comparison
Creek
Immigrants from Korea
$82,560
MEDIAN FAMILY INCOME
0.0/ 100
METRIC RATING
324th/ 347
METRIC RANK
$122,800
MEDIAN FAMILY INCOME
100.0/ 100
METRIC RATING
21st/ 347
METRIC RANK
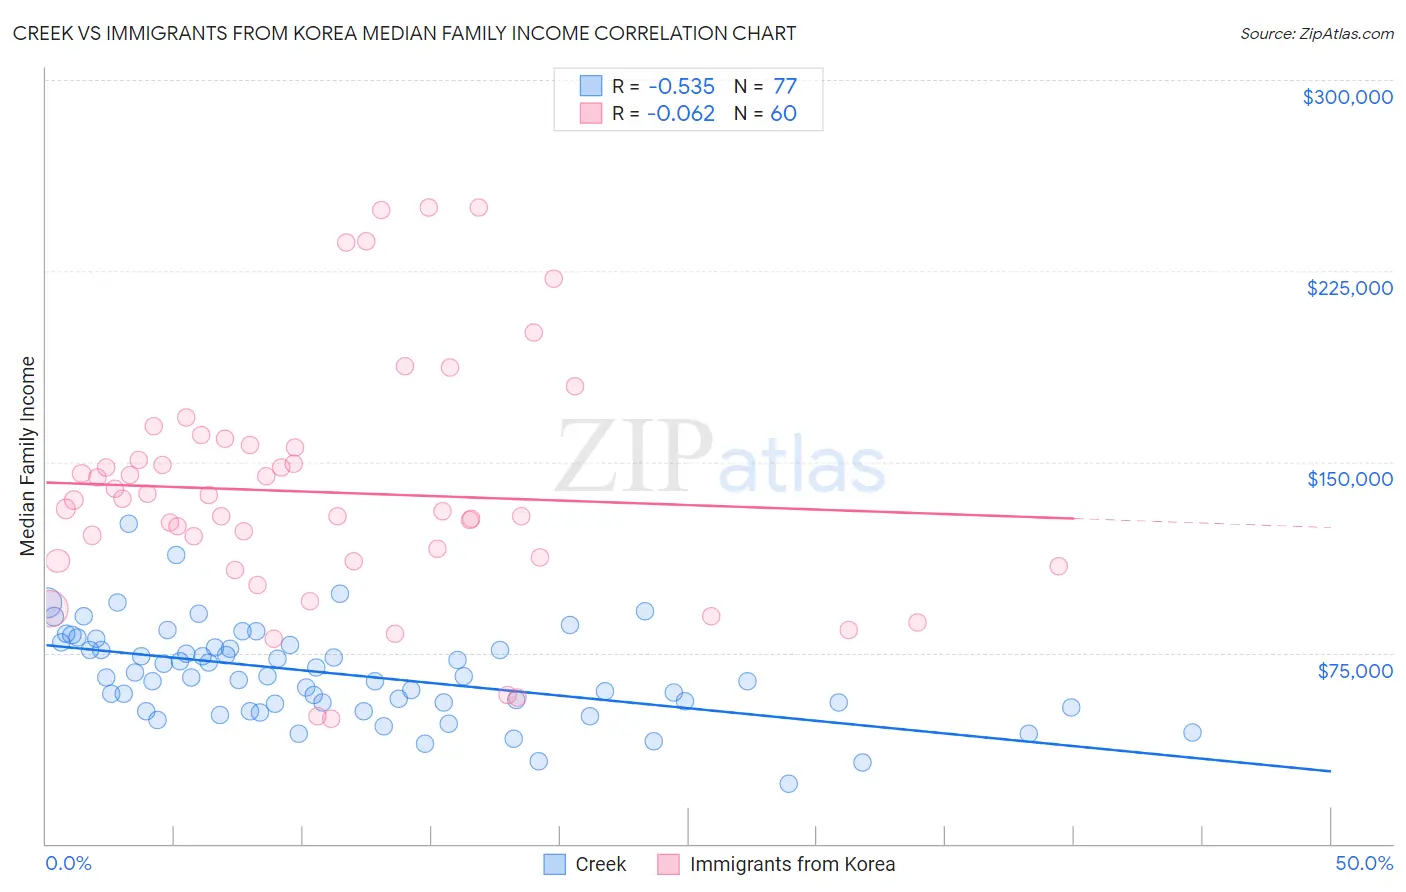
Creek vs Immigrants from Korea Median Family Income Correlation Chart
The statistical analysis conducted on geographies consisting of 178,420,625 people shows a substantial negative correlation between the proportion of Creek and median family income in the United States with a correlation coefficient (R) of -0.535 and weighted average of $82,560. Similarly, the statistical analysis conducted on geographies consisting of 415,814,318 people shows a slight negative correlation between the proportion of Immigrants from Korea and median family income in the United States with a correlation coefficient (R) of -0.062 and weighted average of $122,800, a difference of 48.7%.
Median Family Income Correlation Summary
| Measurement | Creek | Immigrants from Korea |
| Minimum | $23,750 | $49,182 |
| Maximum | $125,671 | $250,001 |
| Range | $101,921 | $200,819 |
| Mean | $66,532 | $138,061 |
| Median | $65,440 | $133,220 |
| Interquartile 25% (IQ1) | $54,458 | $110,996 |
| Interquartile 75% (IQ3) | $77,450 | $156,101 |
| Interquartile Range (IQR) | $22,992 | $45,105 |
| Standard Deviation (Sample) | $18,322 | $47,393 |
| Standard Deviation (Population) | $18,202 | $46,996 |
Similar Demographics by Median Family Income
Demographics Similar to Creek by Median Family Income
In terms of median family income, the demographic groups most similar to Creek are Bahamian ($82,631, a difference of 0.090%), Sioux ($82,386, a difference of 0.21%), Dominican ($82,888, a difference of 0.40%), Immigrants from Congo ($82,216, a difference of 0.42%), and Arapaho ($82,064, a difference of 0.61%).
| Demographics | Rating | Rank | Median Family Income |
| Yakama | 0.0 /100 | #317 | Tragic $83,932 |
| Immigrants | Mexico | 0.0 /100 | #318 | Tragic $83,639 |
| Immigrants | Honduras | 0.0 /100 | #319 | Tragic $83,618 |
| Seminole | 0.0 /100 | #320 | Tragic $83,354 |
| Immigrants | Caribbean | 0.0 /100 | #321 | Tragic $83,319 |
| Dominicans | 0.0 /100 | #322 | Tragic $82,888 |
| Bahamians | 0.0 /100 | #323 | Tragic $82,631 |
| Creek | 0.0 /100 | #324 | Tragic $82,560 |
| Sioux | 0.0 /100 | #325 | Tragic $82,386 |
| Immigrants | Congo | 0.0 /100 | #326 | Tragic $82,216 |
| Arapaho | 0.0 /100 | #327 | Tragic $82,064 |
| Blacks/African Americans | 0.0 /100 | #328 | Tragic $81,912 |
| Dutch West Indians | 0.0 /100 | #329 | Tragic $81,852 |
| Cheyenne | 0.0 /100 | #330 | Tragic $81,385 |
| Immigrants | Dominican Republic | 0.0 /100 | #331 | Tragic $81,233 |
Demographics Similar to Immigrants from Korea by Median Family Income
In terms of median family income, the demographic groups most similar to Immigrants from Korea are Immigrants from Sweden ($122,765, a difference of 0.030%), Immigrants from Japan ($122,764, a difference of 0.030%), Burmese ($123,369, a difference of 0.46%), Immigrants from Northern Europe ($121,840, a difference of 0.79%), and Immigrants from Belgium ($123,831, a difference of 0.84%).
| Demographics | Rating | Rank | Median Family Income |
| Immigrants | South Central Asia | 100.0 /100 | #14 | Exceptional $125,956 |
| Eastern Europeans | 100.0 /100 | #15 | Exceptional $125,546 |
| Immigrants | China | 100.0 /100 | #16 | Exceptional $125,540 |
| Indians (Asian) | 100.0 /100 | #17 | Exceptional $125,312 |
| Immigrants | Eastern Asia | 100.0 /100 | #18 | Exceptional $125,150 |
| Immigrants | Belgium | 100.0 /100 | #19 | Exceptional $123,831 |
| Burmese | 100.0 /100 | #20 | Exceptional $123,369 |
| Immigrants | Korea | 100.0 /100 | #21 | Exceptional $122,800 |
| Immigrants | Sweden | 100.0 /100 | #22 | Exceptional $122,765 |
| Immigrants | Japan | 100.0 /100 | #23 | Exceptional $122,764 |
| Immigrants | Northern Europe | 100.0 /100 | #24 | Exceptional $121,840 |
| Turks | 100.0 /100 | #25 | Exceptional $121,202 |
| Immigrants | Switzerland | 100.0 /100 | #26 | Exceptional $120,726 |
| Russians | 100.0 /100 | #27 | Exceptional $120,487 |
| Immigrants | Denmark | 100.0 /100 | #28 | Exceptional $120,445 |