Creek vs Immigrants from Senegal Median Family Income
COMPARE
Creek
Immigrants from Senegal
Median Family Income
Median Family Income Comparison
Creek
Immigrants from Senegal
$82,560
MEDIAN FAMILY INCOME
0.0/ 100
METRIC RATING
324th/ 347
METRIC RANK
$92,912
MEDIAN FAMILY INCOME
0.7/ 100
METRIC RATING
247th/ 347
METRIC RANK
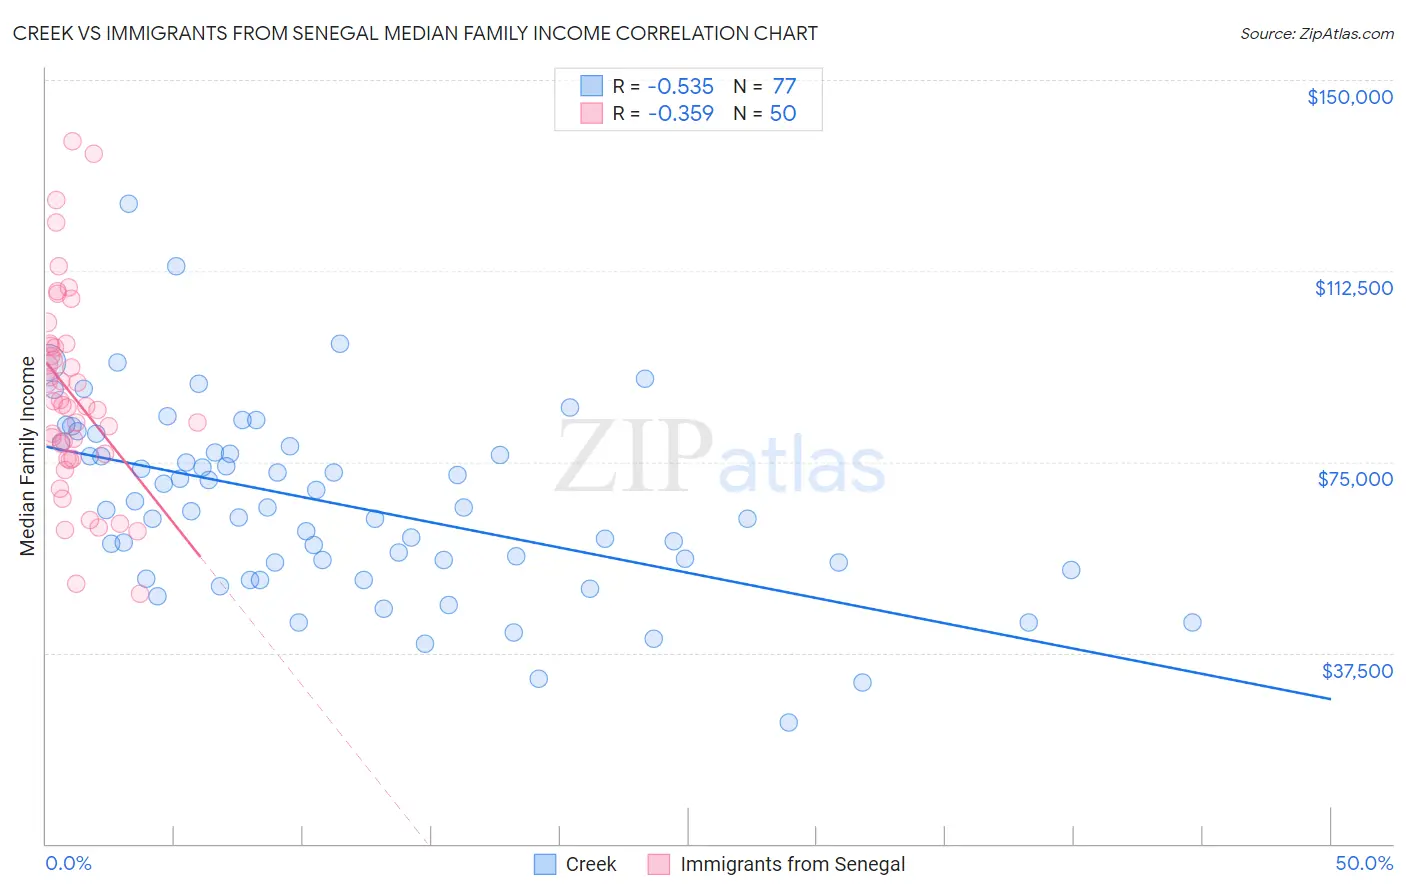
Creek vs Immigrants from Senegal Median Family Income Correlation Chart
The statistical analysis conducted on geographies consisting of 178,420,625 people shows a substantial negative correlation between the proportion of Creek and median family income in the United States with a correlation coefficient (R) of -0.535 and weighted average of $82,560. Similarly, the statistical analysis conducted on geographies consisting of 90,105,018 people shows a mild negative correlation between the proportion of Immigrants from Senegal and median family income in the United States with a correlation coefficient (R) of -0.359 and weighted average of $92,912, a difference of 12.5%.
Median Family Income Correlation Summary
| Measurement | Creek | Immigrants from Senegal |
| Minimum | $23,750 | $49,167 |
| Maximum | $125,671 | $137,892 |
| Range | $101,921 | $88,725 |
| Mean | $66,532 | $87,849 |
| Median | $65,440 | $85,966 |
| Interquartile 25% (IQ1) | $54,458 | $75,730 |
| Interquartile 75% (IQ3) | $77,450 | $97,800 |
| Interquartile Range (IQR) | $22,992 | $22,070 |
| Standard Deviation (Sample) | $18,322 | $19,522 |
| Standard Deviation (Population) | $18,202 | $19,326 |
Similar Demographics by Median Family Income
Demographics Similar to Creek by Median Family Income
In terms of median family income, the demographic groups most similar to Creek are Bahamian ($82,631, a difference of 0.090%), Sioux ($82,386, a difference of 0.21%), Dominican ($82,888, a difference of 0.40%), Immigrants from Congo ($82,216, a difference of 0.42%), and Arapaho ($82,064, a difference of 0.61%).
| Demographics | Rating | Rank | Median Family Income |
| Yakama | 0.0 /100 | #317 | Tragic $83,932 |
| Immigrants | Mexico | 0.0 /100 | #318 | Tragic $83,639 |
| Immigrants | Honduras | 0.0 /100 | #319 | Tragic $83,618 |
| Seminole | 0.0 /100 | #320 | Tragic $83,354 |
| Immigrants | Caribbean | 0.0 /100 | #321 | Tragic $83,319 |
| Dominicans | 0.0 /100 | #322 | Tragic $82,888 |
| Bahamians | 0.0 /100 | #323 | Tragic $82,631 |
| Creek | 0.0 /100 | #324 | Tragic $82,560 |
| Sioux | 0.0 /100 | #325 | Tragic $82,386 |
| Immigrants | Congo | 0.0 /100 | #326 | Tragic $82,216 |
| Arapaho | 0.0 /100 | #327 | Tragic $82,064 |
| Blacks/African Americans | 0.0 /100 | #328 | Tragic $81,912 |
| Dutch West Indians | 0.0 /100 | #329 | Tragic $81,852 |
| Cheyenne | 0.0 /100 | #330 | Tragic $81,385 |
| Immigrants | Dominican Republic | 0.0 /100 | #331 | Tragic $81,233 |
Demographics Similar to Immigrants from Senegal by Median Family Income
In terms of median family income, the demographic groups most similar to Immigrants from Senegal are French American Indian ($92,872, a difference of 0.040%), Immigrants from Ecuador ($92,837, a difference of 0.080%), West Indian ($92,765, a difference of 0.16%), Immigrants from Somalia ($92,609, a difference of 0.33%), and Immigrants from El Salvador ($92,545, a difference of 0.40%).
| Demographics | Rating | Rank | Median Family Income |
| Somalis | 1.2 /100 | #240 | Tragic $94,085 |
| Immigrants | Trinidad and Tobago | 1.2 /100 | #241 | Tragic $93,988 |
| Barbadians | 1.1 /100 | #242 | Tragic $93,919 |
| German Russians | 1.1 /100 | #243 | Tragic $93,858 |
| Sub-Saharan Africans | 1.0 /100 | #244 | Tragic $93,748 |
| Immigrants | Middle Africa | 1.0 /100 | #245 | Tragic $93,593 |
| Guyanese | 0.9 /100 | #246 | Tragic $93,373 |
| Immigrants | Senegal | 0.7 /100 | #247 | Tragic $92,912 |
| French American Indians | 0.7 /100 | #248 | Tragic $92,872 |
| Immigrants | Ecuador | 0.7 /100 | #249 | Tragic $92,837 |
| West Indians | 0.6 /100 | #250 | Tragic $92,765 |
| Immigrants | Somalia | 0.6 /100 | #251 | Tragic $92,609 |
| Immigrants | El Salvador | 0.6 /100 | #252 | Tragic $92,545 |
| Immigrants | Guyana | 0.6 /100 | #253 | Tragic $92,513 |
| Immigrants | Barbados | 0.5 /100 | #254 | Tragic $92,419 |