Comanche vs Immigrants from Norway Median Female Earnings
COMPARE
Comanche
Immigrants from Norway
Median Female Earnings
Median Female Earnings Comparison
Comanche
Immigrants from Norway
$35,661
MEDIAN FEMALE EARNINGS
0.0/ 100
METRIC RATING
295th/ 347
METRIC RANK
$42,837
MEDIAN FEMALE EARNINGS
99.9/ 100
METRIC RATING
66th/ 347
METRIC RANK
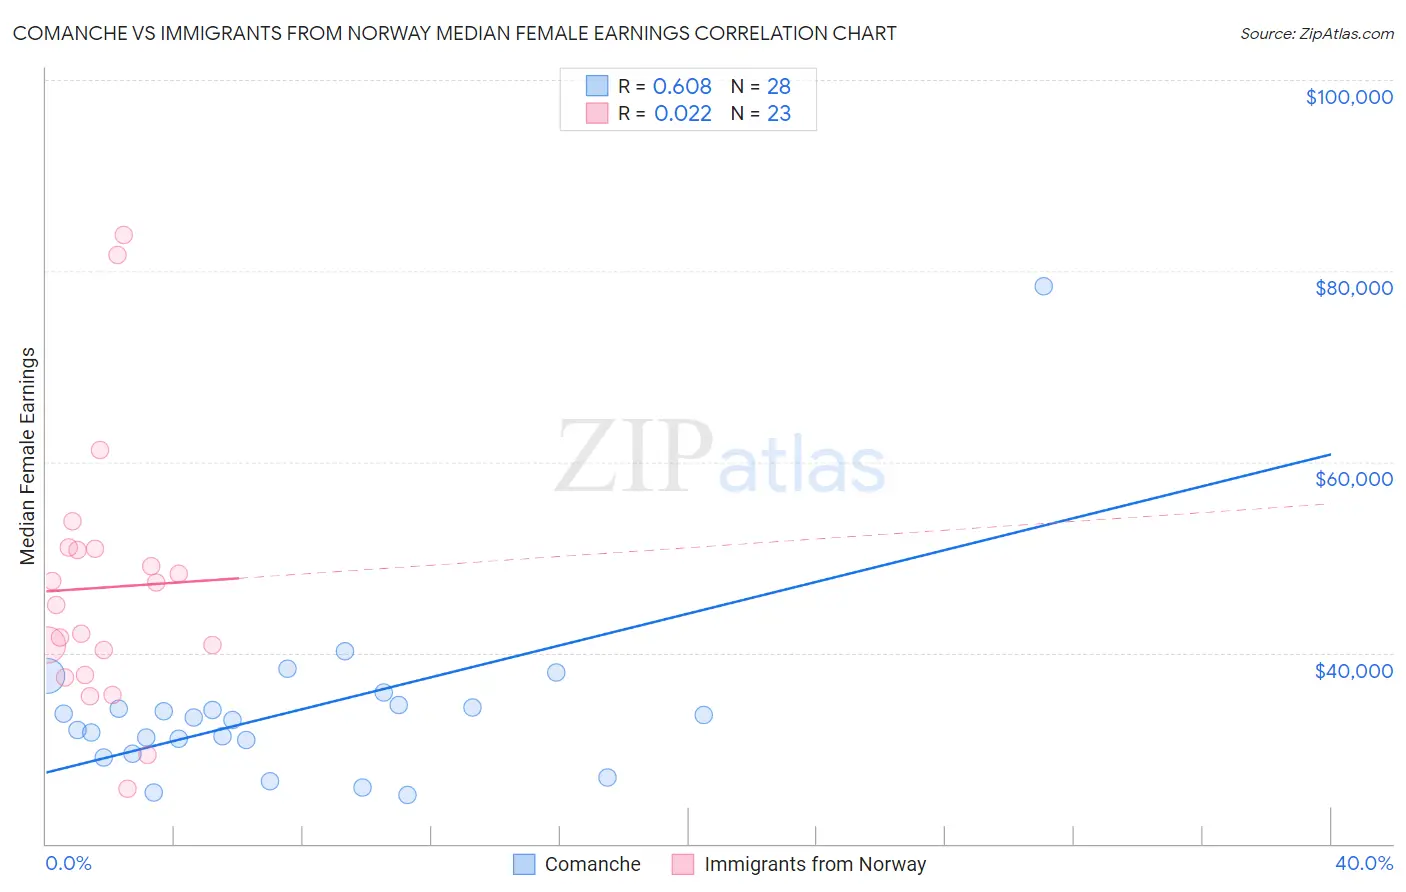
Comanche vs Immigrants from Norway Median Female Earnings Correlation Chart
The statistical analysis conducted on geographies consisting of 109,756,357 people shows a significant positive correlation between the proportion of Comanche and median female earnings in the United States with a correlation coefficient (R) of 0.608 and weighted average of $35,661. Similarly, the statistical analysis conducted on geographies consisting of 116,697,364 people shows no correlation between the proportion of Immigrants from Norway and median female earnings in the United States with a correlation coefficient (R) of 0.022 and weighted average of $42,837, a difference of 20.1%.
Median Female Earnings Correlation Summary
| Measurement | Comanche | Immigrants from Norway |
| Minimum | $25,100 | $25,783 |
| Maximum | $78,452 | $83,727 |
| Range | $53,352 | $57,944 |
| Mean | $33,877 | $46,834 |
| Median | $33,076 | $44,998 |
| Interquartile 25% (IQ1) | $30,131 | $37,628 |
| Interquartile 75% (IQ3) | $34,372 | $50,939 |
| Interquartile Range (IQR) | $4,241 | $13,311 |
| Standard Deviation (Sample) | $9,585 | $13,874 |
| Standard Deviation (Population) | $9,413 | $13,569 |
Similar Demographics by Median Female Earnings
Demographics Similar to Comanche by Median Female Earnings
In terms of median female earnings, the demographic groups most similar to Comanche are Cheyenne ($35,673, a difference of 0.030%), Guatemalan ($35,695, a difference of 0.090%), Mexican American Indian ($35,629, a difference of 0.090%), American ($35,777, a difference of 0.32%), and Hmong ($35,498, a difference of 0.46%).
| Demographics | Rating | Rank | Median Female Earnings |
| Immigrants | Zaire | 0.0 /100 | #288 | Tragic $36,017 |
| Bangladeshis | 0.0 /100 | #289 | Tragic $35,960 |
| Central American Indians | 0.0 /100 | #290 | Tragic $35,930 |
| Blackfeet | 0.0 /100 | #291 | Tragic $35,864 |
| Americans | 0.0 /100 | #292 | Tragic $35,777 |
| Guatemalans | 0.0 /100 | #293 | Tragic $35,695 |
| Cheyenne | 0.0 /100 | #294 | Tragic $35,673 |
| Comanche | 0.0 /100 | #295 | Tragic $35,661 |
| Mexican American Indians | 0.0 /100 | #296 | Tragic $35,629 |
| Hmong | 0.0 /100 | #297 | Tragic $35,498 |
| Immigrants | Micronesia | 0.0 /100 | #298 | Tragic $35,477 |
| Immigrants | Guatemala | 0.0 /100 | #299 | Tragic $35,444 |
| Yuman | 0.0 /100 | #300 | Tragic $35,377 |
| Pima | 0.0 /100 | #301 | Tragic $35,326 |
| Blacks/African Americans | 0.0 /100 | #302 | Tragic $35,315 |
Demographics Similar to Immigrants from Norway by Median Female Earnings
In terms of median female earnings, the demographic groups most similar to Immigrants from Norway are Immigrants from Egypt ($42,837, a difference of 0.0%), Immigrants from Austria ($42,824, a difference of 0.030%), Immigrants from Spain ($42,815, a difference of 0.050%), Sierra Leonean ($42,868, a difference of 0.070%), and Immigrants from Ethiopia ($42,744, a difference of 0.22%).
| Demographics | Rating | Rank | Median Female Earnings |
| Estonians | 99.9 /100 | #59 | Exceptional $43,106 |
| Immigrants | Latvia | 99.9 /100 | #60 | Exceptional $43,099 |
| Immigrants | Bulgaria | 99.9 /100 | #61 | Exceptional $43,085 |
| Afghans | 99.9 /100 | #62 | Exceptional $43,077 |
| Immigrants | Ukraine | 99.9 /100 | #63 | Exceptional $43,069 |
| Immigrants | Pakistan | 99.9 /100 | #64 | Exceptional $43,052 |
| Sierra Leoneans | 99.9 /100 | #65 | Exceptional $42,868 |
| Immigrants | Norway | 99.9 /100 | #66 | Exceptional $42,837 |
| Immigrants | Egypt | 99.9 /100 | #67 | Exceptional $42,837 |
| Immigrants | Austria | 99.8 /100 | #68 | Exceptional $42,824 |
| Immigrants | Spain | 99.8 /100 | #69 | Exceptional $42,815 |
| Immigrants | Ethiopia | 99.8 /100 | #70 | Exceptional $42,744 |
| Immigrants | Romania | 99.8 /100 | #71 | Exceptional $42,718 |
| Albanians | 99.8 /100 | #72 | Exceptional $42,584 |
| Mongolians | 99.7 /100 | #73 | Exceptional $42,542 |