Comanche vs Latvian Median Female Earnings
COMPARE
Comanche
Latvian
Median Female Earnings
Median Female Earnings Comparison
Comanche
Latvians
$35,661
MEDIAN FEMALE EARNINGS
0.0/ 100
METRIC RATING
295th/ 347
METRIC RANK
$43,941
MEDIAN FEMALE EARNINGS
100.0/ 100
METRIC RATING
38th/ 347
METRIC RANK
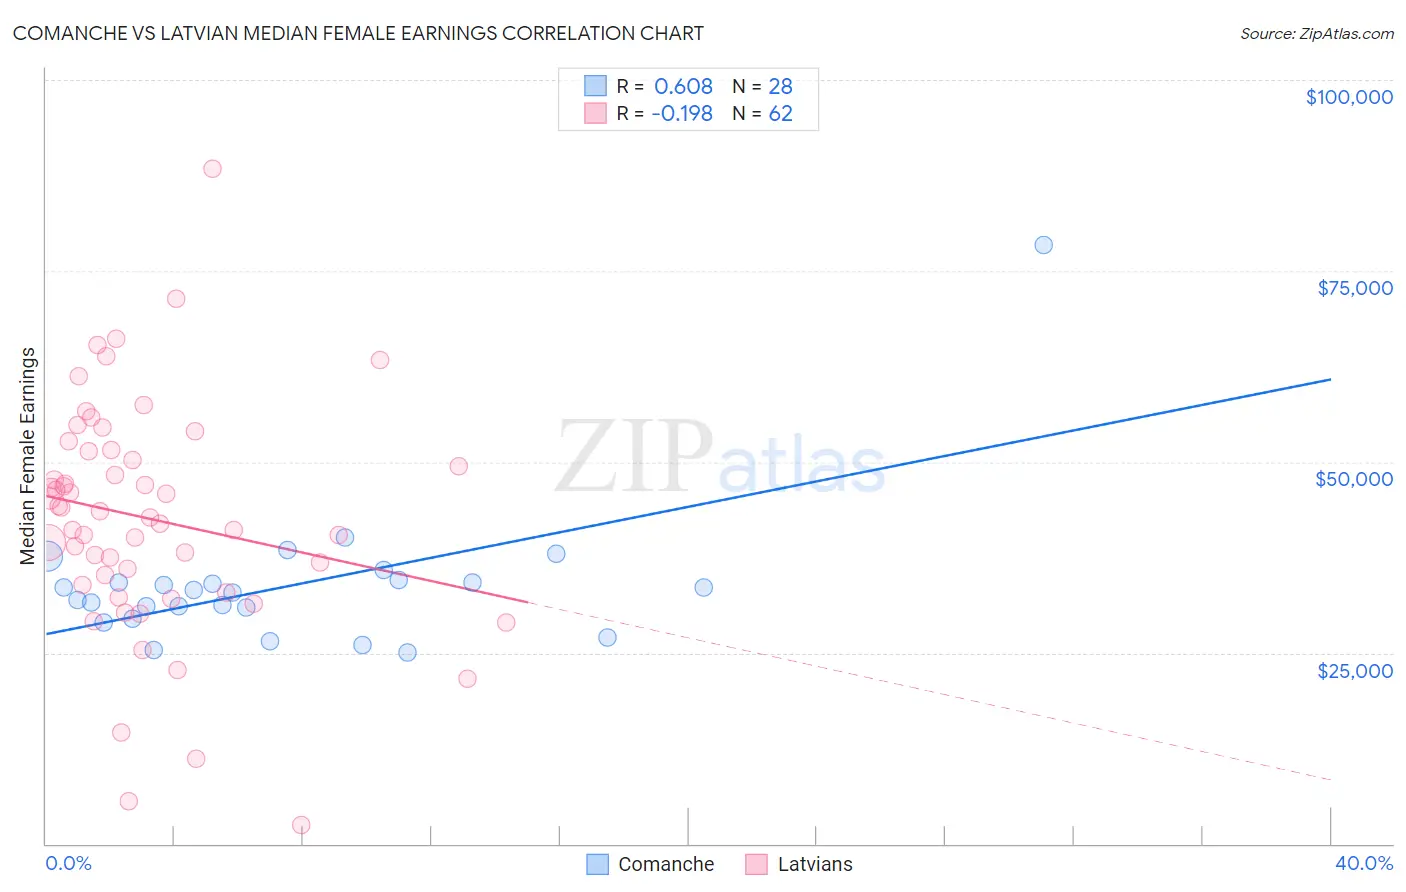
Comanche vs Latvian Median Female Earnings Correlation Chart
The statistical analysis conducted on geographies consisting of 109,756,357 people shows a significant positive correlation between the proportion of Comanche and median female earnings in the United States with a correlation coefficient (R) of 0.608 and weighted average of $35,661. Similarly, the statistical analysis conducted on geographies consisting of 220,706,355 people shows a poor negative correlation between the proportion of Latvians and median female earnings in the United States with a correlation coefficient (R) of -0.198 and weighted average of $43,941, a difference of 23.2%.
Median Female Earnings Correlation Summary
| Measurement | Comanche | Latvian |
| Minimum | $25,100 | $2,499 |
| Maximum | $78,452 | $88,365 |
| Range | $53,352 | $85,866 |
| Mean | $33,877 | $42,555 |
| Median | $33,076 | $43,118 |
| Interquartile 25% (IQ1) | $30,131 | $33,868 |
| Interquartile 75% (IQ3) | $34,372 | $51,451 |
| Interquartile Range (IQR) | $4,241 | $17,583 |
| Standard Deviation (Sample) | $9,585 | $15,211 |
| Standard Deviation (Population) | $9,413 | $15,087 |
Similar Demographics by Median Female Earnings
Demographics Similar to Comanche by Median Female Earnings
In terms of median female earnings, the demographic groups most similar to Comanche are Cheyenne ($35,673, a difference of 0.030%), Guatemalan ($35,695, a difference of 0.090%), Mexican American Indian ($35,629, a difference of 0.090%), American ($35,777, a difference of 0.32%), and Hmong ($35,498, a difference of 0.46%).
| Demographics | Rating | Rank | Median Female Earnings |
| Immigrants | Zaire | 0.0 /100 | #288 | Tragic $36,017 |
| Bangladeshis | 0.0 /100 | #289 | Tragic $35,960 |
| Central American Indians | 0.0 /100 | #290 | Tragic $35,930 |
| Blackfeet | 0.0 /100 | #291 | Tragic $35,864 |
| Americans | 0.0 /100 | #292 | Tragic $35,777 |
| Guatemalans | 0.0 /100 | #293 | Tragic $35,695 |
| Cheyenne | 0.0 /100 | #294 | Tragic $35,673 |
| Comanche | 0.0 /100 | #295 | Tragic $35,661 |
| Mexican American Indians | 0.0 /100 | #296 | Tragic $35,629 |
| Hmong | 0.0 /100 | #297 | Tragic $35,498 |
| Immigrants | Micronesia | 0.0 /100 | #298 | Tragic $35,477 |
| Immigrants | Guatemala | 0.0 /100 | #299 | Tragic $35,444 |
| Yuman | 0.0 /100 | #300 | Tragic $35,377 |
| Pima | 0.0 /100 | #301 | Tragic $35,326 |
| Blacks/African Americans | 0.0 /100 | #302 | Tragic $35,315 |
Demographics Similar to Latvians by Median Female Earnings
In terms of median female earnings, the demographic groups most similar to Latvians are Immigrants from Switzerland ($43,996, a difference of 0.12%), Israeli ($43,852, a difference of 0.20%), Immigrants from Malaysia ($43,835, a difference of 0.24%), Immigrants from Turkey ($44,066, a difference of 0.28%), and Immigrants from Sri Lanka ($44,161, a difference of 0.50%).
| Demographics | Rating | Rank | Median Female Earnings |
| Immigrants | France | 100.0 /100 | #31 | Exceptional $44,541 |
| Immigrants | Northern Europe | 100.0 /100 | #32 | Exceptional $44,366 |
| Immigrants | Asia | 100.0 /100 | #33 | Exceptional $44,198 |
| Russians | 100.0 /100 | #34 | Exceptional $44,169 |
| Immigrants | Sri Lanka | 100.0 /100 | #35 | Exceptional $44,161 |
| Immigrants | Turkey | 100.0 /100 | #36 | Exceptional $44,066 |
| Immigrants | Switzerland | 100.0 /100 | #37 | Exceptional $43,996 |
| Latvians | 100.0 /100 | #38 | Exceptional $43,941 |
| Israelis | 100.0 /100 | #39 | Exceptional $43,852 |
| Immigrants | Malaysia | 100.0 /100 | #40 | Exceptional $43,835 |
| Bhutanese | 100.0 /100 | #41 | Exceptional $43,648 |
| Immigrants | Denmark | 100.0 /100 | #42 | Exceptional $43,646 |
| Bulgarians | 100.0 /100 | #43 | Exceptional $43,638 |
| Immigrants | Czechoslovakia | 100.0 /100 | #44 | Exceptional $43,571 |
| Immigrants | Europe | 100.0 /100 | #45 | Exceptional $43,523 |