Honduran vs Japanese Median Male Earnings
COMPARE
Honduran
Japanese
Median Male Earnings
Median Male Earnings Comparison
Hondurans
Japanese
$46,374
MEDIAN MALE EARNINGS
0.0/ 100
METRIC RATING
313th/ 347
METRIC RANK
$51,473
MEDIAN MALE EARNINGS
4.9/ 100
METRIC RATING
226th/ 347
METRIC RANK
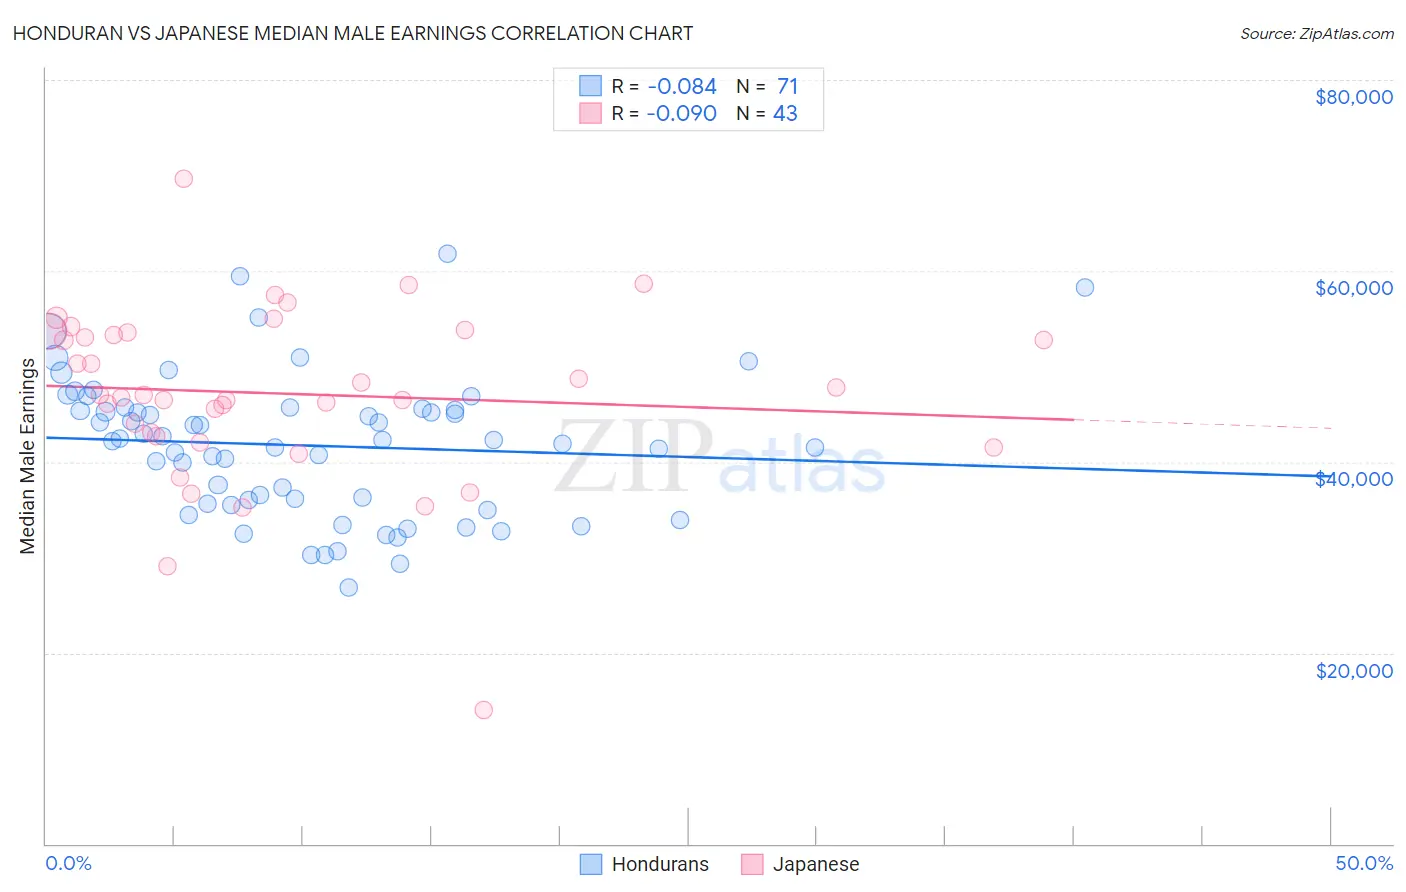
Honduran vs Japanese Median Male Earnings Correlation Chart
The statistical analysis conducted on geographies consisting of 357,792,552 people shows a slight negative correlation between the proportion of Hondurans and median male earnings in the United States with a correlation coefficient (R) of -0.084 and weighted average of $46,374. Similarly, the statistical analysis conducted on geographies consisting of 249,157,630 people shows a slight negative correlation between the proportion of Japanese and median male earnings in the United States with a correlation coefficient (R) of -0.090 and weighted average of $51,473, a difference of 11.0%.
Median Male Earnings Correlation Summary
| Measurement | Honduran | Japanese |
| Minimum | $26,786 | $14,032 |
| Maximum | $61,786 | $69,626 |
| Range | $35,000 | $55,594 |
| Mean | $41,717 | $47,153 |
| Median | $42,264 | $47,032 |
| Interquartile 25% (IQ1) | $35,639 | $42,663 |
| Interquartile 75% (IQ3) | $45,572 | $53,598 |
| Interquartile Range (IQR) | $9,933 | $10,935 |
| Standard Deviation (Sample) | $7,373 | $9,237 |
| Standard Deviation (Population) | $7,321 | $9,129 |
Similar Demographics by Median Male Earnings
Demographics Similar to Hondurans by Median Male Earnings
In terms of median male earnings, the demographic groups most similar to Hondurans are Chippewa ($46,368, a difference of 0.010%), Hispanic or Latino ($46,419, a difference of 0.10%), Apache ($46,429, a difference of 0.12%), Immigrants from Guatemala ($46,244, a difference of 0.28%), and Immigrants from Caribbean ($46,193, a difference of 0.39%).
| Demographics | Rating | Rank | Median Male Earnings |
| Dutch West Indians | 0.0 /100 | #306 | Tragic $46,656 |
| Immigrants | Dominican Republic | 0.0 /100 | #307 | Tragic $46,655 |
| Ottawa | 0.0 /100 | #308 | Tragic $46,611 |
| Creek | 0.0 /100 | #309 | Tragic $46,594 |
| Cubans | 0.0 /100 | #310 | Tragic $46,580 |
| Apache | 0.0 /100 | #311 | Tragic $46,429 |
| Hispanics or Latinos | 0.0 /100 | #312 | Tragic $46,419 |
| Hondurans | 0.0 /100 | #313 | Tragic $46,374 |
| Chippewa | 0.0 /100 | #314 | Tragic $46,368 |
| Immigrants | Guatemala | 0.0 /100 | #315 | Tragic $46,244 |
| Immigrants | Caribbean | 0.0 /100 | #316 | Tragic $46,193 |
| Mexicans | 0.0 /100 | #317 | Tragic $46,147 |
| Cheyenne | 0.0 /100 | #318 | Tragic $46,062 |
| Haitians | 0.0 /100 | #319 | Tragic $45,903 |
| Immigrants | Honduras | 0.0 /100 | #320 | Tragic $45,787 |
Demographics Similar to Japanese by Median Male Earnings
In terms of median male earnings, the demographic groups most similar to Japanese are Immigrants from Sudan ($51,489, a difference of 0.030%), Trinidadian and Tobagonian ($51,446, a difference of 0.050%), Samoan ($51,389, a difference of 0.16%), Immigrants from Trinidad and Tobago ($51,376, a difference of 0.19%), and Immigrants from Cambodia ($51,594, a difference of 0.23%).
| Demographics | Rating | Rank | Median Male Earnings |
| Immigrants | Ghana | 6.9 /100 | #219 | Tragic $51,836 |
| Immigrants | Armenia | 6.6 /100 | #220 | Tragic $51,793 |
| Immigrants | Senegal | 5.8 /100 | #221 | Tragic $51,647 |
| Immigrants | Bangladesh | 5.8 /100 | #222 | Tragic $51,642 |
| Ecuadorians | 5.5 /100 | #223 | Tragic $51,596 |
| Immigrants | Cambodia | 5.5 /100 | #224 | Tragic $51,594 |
| Immigrants | Sudan | 5.0 /100 | #225 | Tragic $51,489 |
| Japanese | 4.9 /100 | #226 | Tragic $51,473 |
| Trinidadians and Tobagonians | 4.8 /100 | #227 | Tragic $51,446 |
| Samoans | 4.6 /100 | #228 | Tragic $51,389 |
| Immigrants | Trinidad and Tobago | 4.5 /100 | #229 | Tragic $51,376 |
| Immigrants | Nigeria | 4.2 /100 | #230 | Tragic $51,310 |
| Barbadians | 3.9 /100 | #231 | Tragic $51,236 |
| Sudanese | 3.9 /100 | #232 | Tragic $51,216 |
| Aleuts | 3.7 /100 | #233 | Tragic $51,168 |