Cherokee vs Pima Wage/Income Gap

COMPARE

Cherokee
Race
Ancestry
AfghanAfricanAlaska NativeAlaskan AthabascanAlbanianAleutAlsatianAmericanApacheArabArapahoArgentineanArmenianAssyrian/Chaldean/SyriacAustralianAustrianBahamianBangladeshiBarbadianBasqueBelgianBelizeanBermudanBhutaneseBlackfeetBolivianBrazilianBritishBritish West IndianBulgarianBurmeseCajunCambodianCanadianCape VerdeanCarpatho RusynCelticCentral AmericanCentral American IndianCherokeeCheyenneChickasawChileanChineseChippewaChoctawColombianColvilleComancheCosta RicanCreeCreekCroatianCrowCubanCypriotCzechCzechoslovakianDanishDelawareDominicanDutchDutch West IndianEastern EuropeanEcuadorianEgyptianEnglishEstonianEthiopianEuropeanFijianFilipinoFinnishFrenchFrench American IndianFrench CanadianGermanGerman RussianGhanaianGreekGuamanian/ChamorroGuatemalanGuyaneseHaitianHmongHonduranHopiHoumaHungarianIcelanderIndian (Asian)IndonesianInupiatIranianIraqiIrishIroquoisIsraeliItalianJamaicanJapaneseJordanianKenyanKiowaKoreanLaotianLatvianLebaneseLiberianLithuanianLumbeeLuxembourgerMacedonianMalaysianMalteseMarshalleseMenomineeMexicanMexican American IndianMongolianMoroccanNative HawaiianNavajoNepaleseNew ZealanderNicaraguanNigerianNorthern EuropeanNorwegianOkinawanOsageOttawaPaiutePakistaniPalestinianPanamanianParaguayanPennsylvania GermanPeruvianPolishPortuguesePotawatomiPuebloPuerto RicanPuget Sound SalishRomanianRussianSalvadoranSamoanScandinavianScotch-IrishScottishSeminoleSenegaleseSerbianShoshoneSierra LeoneanSiouxSlavicSlovakSloveneSomaliSouth AfricanSouth AmericanSouth American IndianSoviet UnionSpaniardSpanishSpanish AmericanSpanish American IndianSri LankanSubsaharan AfricanSudaneseSwedishSwissSyrianTaiwaneseThaiTlingit-HaidaTohono O'OdhamTonganTrinidadian and TobagonianTsimshianTurkishU.S. Virgin IslanderUgandanUkrainianUruguayanUteVenezuelanVietnameseWelshWest IndianYakamaYaquiYugoslavianYumanYup'ikZimbabwean
Immigration
NonimmigrantsImmigrantsAfghanistanAfricaAlbaniaArgentinaArmeniaAsiaAustraliaAustriaBahamasBangladeshBarbadosBelarusBelgiumBelizeBoliviaBosnia and HerzegovinaBrazilBulgariaBurma/MyanmarCabo VerdeCambodiaCameroonCanadaCaribbeanCentral AmericaChileChinaColombiaCongoCosta RicaCroatiaCubaCzechoslovakiaDenmarkDominicaDominican RepublicEastern AfricaEastern AsiaEastern EuropeEcuadorEgyptEl SalvadorEnglandEritreaEthiopiaEuropeFijiFranceGermanyGhanaGreeceGrenadaGuatemalaGuyanaHaitiHondurasHong KongHungaryIndiaIndonesiaIranIraqIrelandIsraelItalyJamaicaJapanJordanKazakhstanKenyaKoreaKuwaitLaosLatin AmericaLatviaLebanonLiberiaLithuaniaMalaysiaMexicoMicronesiaMiddle AfricaMoldovaMoroccoNepalNetherlandsNicaraguaNigeriaNorth AmericaNorth MacedoniaNorthern AfricaNorthern EuropeNorwayOceaniaPakistanPanamaPeruPhilippinesPolandPortugalRomaniaRussiaSaudi ArabiaScotlandSenegalSerbiaSierra LeoneSingaporeSomaliaSouth AfricaSouth AmericaSouth Central AsiaSouth Eastern AsiaSouthern EuropeSpainSri LankaSt. Vincent and the GrenadinesSudanSwedenSwitzerlandSyriaTaiwanThailandTrinidad and TobagoTurkeyUgandaUkraineUruguayUzbekistanVenezuelaVietnamWest IndiesWestern AfricaWestern AsiaWestern EuropeYemenZaireZimbabweAzores
Pima
Race
Ancestry
AfghanAfricanAlaska NativeAlaskan AthabascanAlbanianAleutAlsatianAmericanApacheArabArapahoArgentineanArmenianAssyrian/Chaldean/SyriacAustralianAustrianBahamianBangladeshiBarbadianBasqueBelgianBelizeanBermudanBhutaneseBlackfeetBolivianBrazilianBritishBritish West IndianBulgarianBurmeseCajunCambodianCanadianCape VerdeanCarpatho RusynCelticCentral AmericanCentral American IndianCheyenneChickasawChileanChineseChippewaChoctawColombianColvilleComancheCosta RicanCreeCreekCroatianCrowCubanCypriotCzechCzechoslovakianDanishDelawareDominicanDutchDutch West IndianEastern EuropeanEcuadorianEgyptianEnglishEstonianEthiopianEuropeanFijianFilipinoFinnishFrenchFrench American IndianFrench CanadianGermanGerman RussianGhanaianGreekGuamanian/ChamorroGuatemalanGuyaneseHaitianHmongHonduranHopiHoumaHungarianIcelanderIndian (Asian)IndonesianInupiatIranianIraqiIrishIroquoisIsraeliItalianJamaicanJapaneseJordanianKenyanKiowaKoreanLaotianLatvianLebaneseLiberianLithuanianLumbeeLuxembourgerMacedonianMalaysianMalteseMarshalleseMenomineeMexicanMexican American IndianMongolianMoroccanNative HawaiianNavajoNepaleseNew ZealanderNicaraguanNigerianNorthern EuropeanNorwegianOkinawanOsageOttawaPaiutePakistaniPalestinianPanamanianParaguayanPennsylvania GermanPeruvianPimaPolishPortuguesePotawatomiPuebloPuerto RicanPuget Sound SalishRomanianRussianSalvadoranSamoanScandinavianScotch-IrishScottishSeminoleSenegaleseSerbianShoshoneSierra LeoneanSiouxSlavicSlovakSloveneSomaliSouth AfricanSouth AmericanSouth American IndianSoviet UnionSpaniardSpanishSpanish AmericanSpanish American IndianSri LankanSubsaharan AfricanSudaneseSwedishSwissSyrianTaiwaneseThaiTlingit-HaidaTohono O'OdhamTonganTrinidadian and TobagonianTsimshianTurkishU.S. Virgin IslanderUgandanUkrainianUruguayanUteVenezuelanVietnameseWelshWest IndianYakamaYaquiYugoslavianYumanYup'ikZimbabwean
Immigration
NonimmigrantsImmigrantsAfghanistanAfricaAlbaniaArgentinaArmeniaAsiaAustraliaAustriaBahamasBangladeshBarbadosBelarusBelgiumBelizeBoliviaBosnia and HerzegovinaBrazilBulgariaBurma/MyanmarCabo VerdeCambodiaCameroonCanadaCaribbeanCentral AmericaChileChinaColombiaCongoCosta RicaCroatiaCubaCzechoslovakiaDenmarkDominicaDominican RepublicEastern AfricaEastern AsiaEastern EuropeEcuadorEgyptEl SalvadorEnglandEritreaEthiopiaEuropeFijiFranceGermanyGhanaGreeceGrenadaGuatemalaGuyanaHaitiHondurasHong KongHungaryIndiaIndonesiaIranIraqIrelandIsraelItalyJamaicaJapanJordanKazakhstanKenyaKoreaKuwaitLaosLatin AmericaLatviaLebanonLiberiaLithuaniaMalaysiaMexicoMicronesiaMiddle AfricaMoldovaMoroccoNepalNetherlandsNicaraguaNigeriaNorth AmericaNorth MacedoniaNorthern AfricaNorthern EuropeNorwayOceaniaPakistanPanamaPeruPhilippinesPolandPortugalRomaniaRussiaSaudi ArabiaScotlandSenegalSerbiaSierra LeoneSingaporeSomaliaSouth AfricaSouth AmericaSouth Central AsiaSouth Eastern AsiaSouthern EuropeSpainSri LankaSt. Vincent and the GrenadinesSudanSwedenSwitzerlandSyriaTaiwanThailandTrinidad and TobagoTurkeyUgandaUkraineUruguayUzbekistanVenezuelaVietnamWest IndiesWestern AfricaWestern AsiaWestern EuropeYemenZaireZimbabweAzores
Wage/Income Gap
Income
Poverty
Unemployment
Labor Participation
Family Structure
Vehicle Availability
Education Level
Disability

Wage/Income Gap Comparison

Cherokee

Pima

Tragic
Exceptional
27.4%
WAGE/INCOME GAP
1.9/ 100
METRIC RATING
256th/ 347
METRIC RANK
21.1%
WAGE/INCOME GAP
100.0/ 100
METRIC RATING
34th/ 347
METRIC RANK

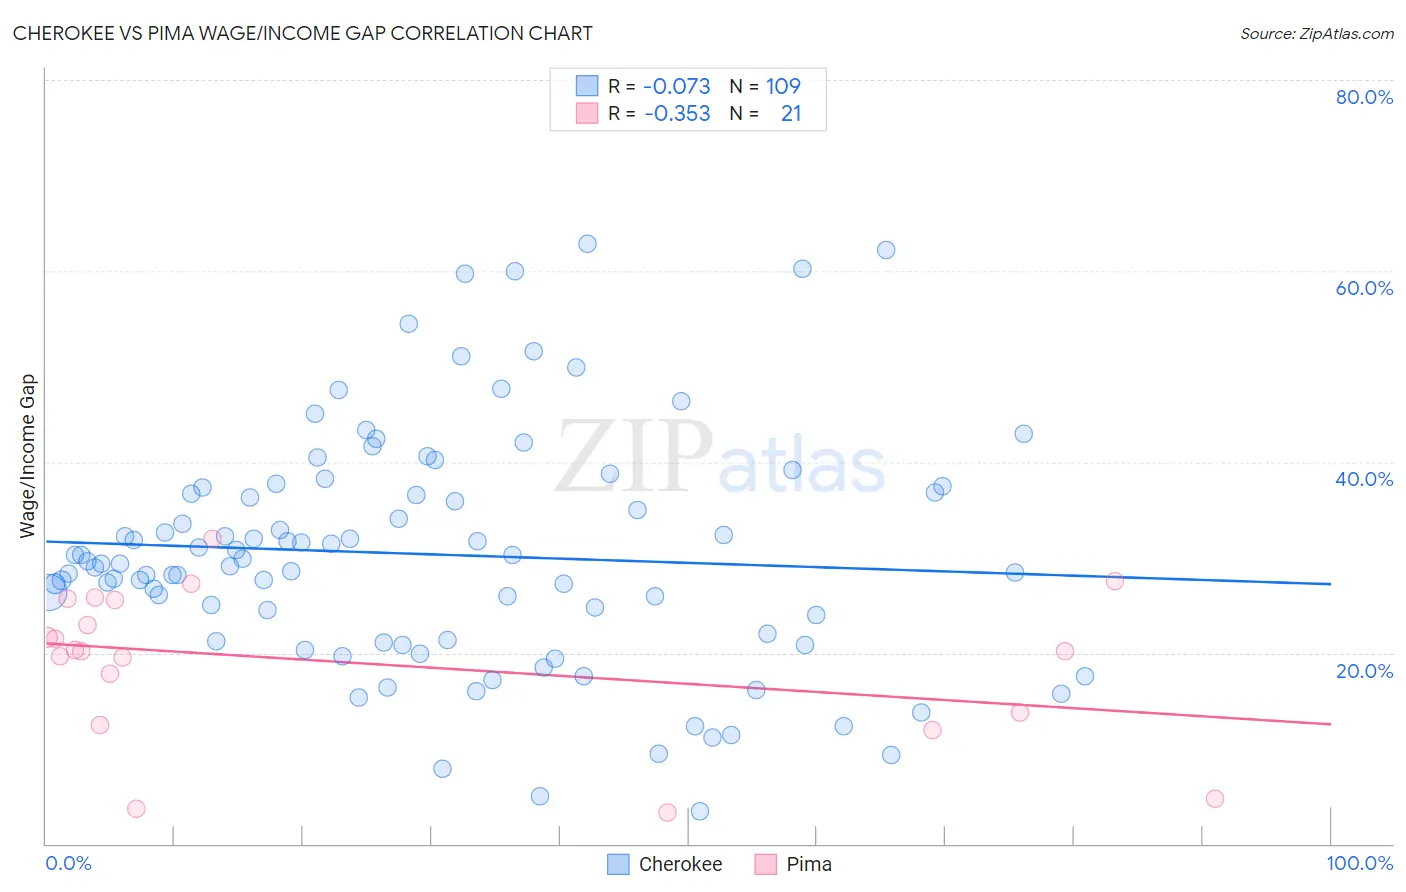
Cherokee vs Pima Wage/Income Gap Correlation Chart

The statistical analysis conducted on geographies consisting of 492,544,110 people shows a slight negative correlation between the proportion of Cherokee and wage/income gap percentage in the United States with a correlation coefficient (R) of -0.073 and weighted average of 27.4%. Similarly, the statistical analysis conducted on geographies consisting of 61,509,383 people shows a mild negative correlation between the proportion of Pima and wage/income gap percentage in the United States with a correlation coefficient (R) of -0.353 and weighted average of 21.1%, a difference of 29.8%.
Cherokee vs Pima Wage/Income Gap

Wage/Income Gap Correlation Summary

MeasurementCherokeePima
Minimum3.4%3.3%
Maximum62.9%31.9%
Range59.5%28.6%
Mean30.3%18.9%
Median29.4%20.2%
Interquartile 25% (IQ1)21.3%13.1%
Interquartile 75% (IQ3)37.1%25.6%
Interquartile Range (IQR)15.8%12.5%
Standard Deviation (Sample)12.4%8.0%
Standard Deviation (Population)12.4%7.8%

Similar Demographics by Wage/Income Gap

Demographics Similar to Cherokee by Wage/Income Gap

In terms of wage/income gap, the demographic groups most similar to Cherokee are Luxembourger (27.4%, a difference of 0.050%), Slavic (27.4%, a difference of 0.090%), Immigrants from France (27.4%, a difference of 0.10%), Israeli (27.4%, a difference of 0.11%), and Icelander (27.5%, a difference of 0.16%).
DemographicsRating | RankWage/Income Gap
Carpatho Rusyns
2.7
/100
|
#249
Tragic
27.3%
Immigrants | Czechoslovakia
2.7
/100
|
#250
Tragic
27.3%
Immigrants | Norway
2.5
/100
|
#251
Tragic
27.3%
Ukrainians
2.4
/100
|
#252
Tragic
27.3%
Portuguese
2.2
/100
|
#253
Tragic
27.4%
Israelis
2.1
/100
|
#254
Tragic
27.4%
Immigrants | France
2.1
/100
|
#255
Tragic
27.4%
Cherokee
1.9
/100
|
#256
Tragic
27.4%
Luxembourgers
1.9
/100
|
#257
Tragic
27.4%
Slavs
1.8
/100
|
#258
Tragic
27.4%
Icelanders
1.8
/100
|
#259
Tragic
27.5%
Tongans
1.7
/100
|
#260
Tragic
27.5%
Immigrants | Germany
1.5
/100
|
#261
Tragic
27.5%
Immigrants | Lebanon
1.5
/100
|
#262
Tragic
27.5%
Syrians
1.4
/100
|
#263
Tragic
27.6%

Demographics Similar to Pima by Wage/Income Gap

In terms of wage/income gap, the demographic groups most similar to Pima are Immigrants from Bahamas (21.1%, a difference of 0.28%), Immigrants from Yemen (21.1%, a difference of 0.30%), Vietnamese (21.0%, a difference of 0.53%), Somali (21.2%, a difference of 0.55%), and Belizean (21.2%, a difference of 0.57%).
DemographicsRating | RankWage/Income Gap
Immigrants | Armenia
100.0
/100
|
#27
Exceptional
20.7%
Inupiat
100.0
/100
|
#28
Exceptional
20.8%
Immigrants | Senegal
100.0
/100
|
#29
Exceptional
20.9%
Immigrants | Bangladesh
100.0
/100
|
#30
Exceptional
20.9%
Vietnamese
100.0
/100
|
#31
Exceptional
21.0%
Immigrants | Yemen
100.0
/100
|
#32
Exceptional
21.1%
Immigrants | Bahamas
100.0
/100
|
#33
Exceptional
21.1%
Pima
100.0
/100
|
#34
Exceptional
21.1%
Somalis
100.0
/100
|
#35
Exceptional
21.2%
Belizeans
100.0
/100
|
#36
Exceptional
21.2%
Immigrants | Somalia
100.0
/100
|
#37
Exceptional
21.2%
Immigrants | Belize
100.0
/100
|
#38
Exceptional
21.3%
Colville
100.0
/100
|
#39
Exceptional
21.3%
Lumbee
100.0
/100
|
#40
Exceptional
21.3%
Liberians
100.0
/100
|
#41
Exceptional
21.4%