Lithuanian vs Pima Wage/Income Gap
COMPARE
Lithuanian
Pima
Wage/Income Gap
Wage/Income Gap Comparison
Lithuanians
Pima
28.7%
WAGE/INCOME GAP
0.1/ 100
METRIC RATING
316th/ 347
METRIC RANK
21.1%
WAGE/INCOME GAP
100.0/ 100
METRIC RATING
34th/ 347
METRIC RANK
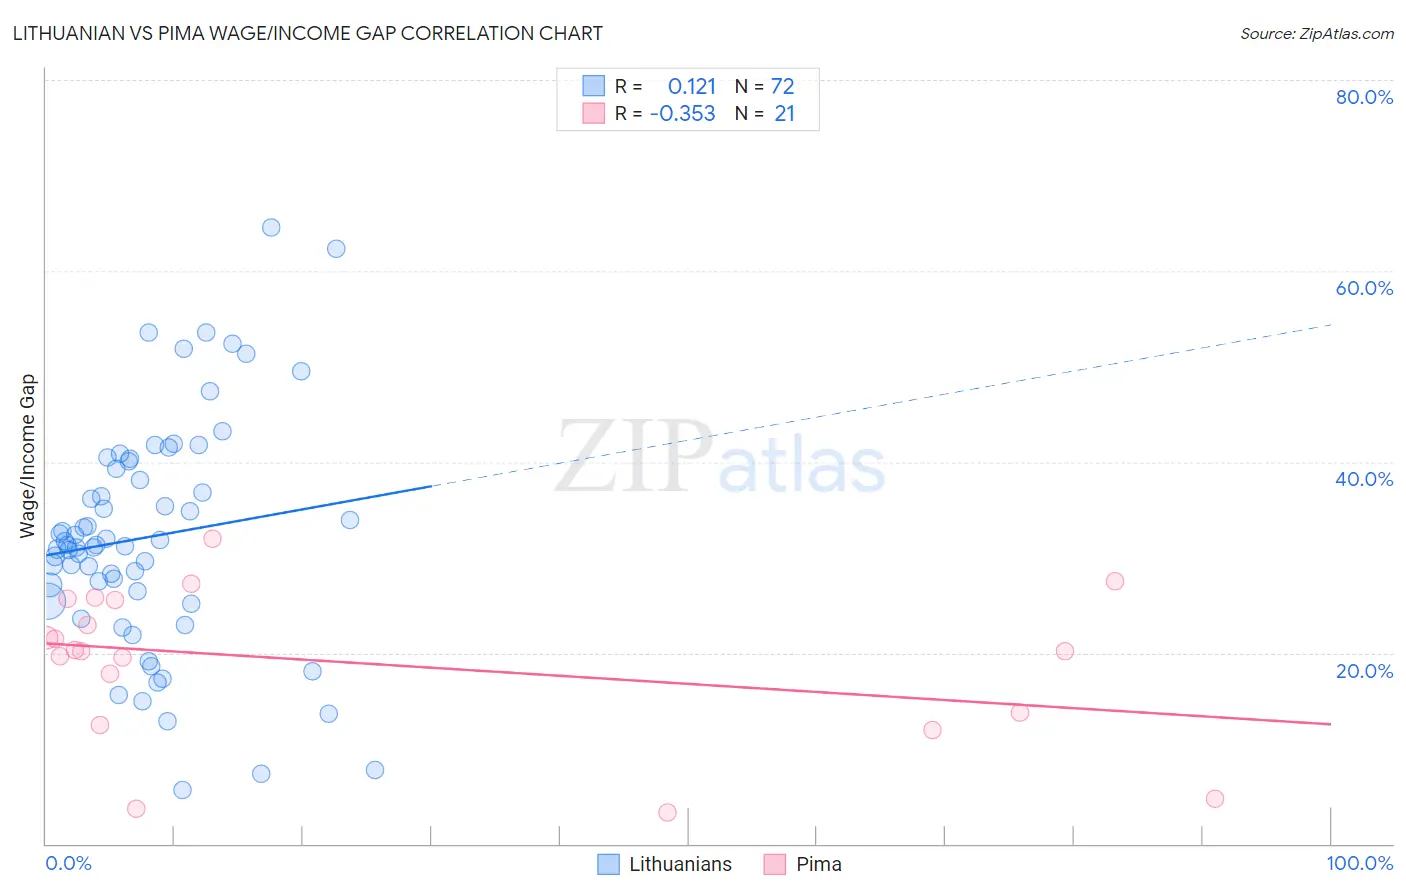
Lithuanian vs Pima Wage/Income Gap Correlation Chart
The statistical analysis conducted on geographies consisting of 421,511,979 people shows a poor positive correlation between the proportion of Lithuanians and wage/income gap percentage in the United States with a correlation coefficient (R) of 0.121 and weighted average of 28.7%. Similarly, the statistical analysis conducted on geographies consisting of 61,509,383 people shows a mild negative correlation between the proportion of Pima and wage/income gap percentage in the United States with a correlation coefficient (R) of -0.353 and weighted average of 21.1%, a difference of 36.1%.
Wage/Income Gap Correlation Summary
| Measurement | Lithuanian | Pima |
| Minimum | 5.6% | 3.3% |
| Maximum | 64.5% | 31.9% |
| Range | 58.9% | 28.6% |
| Mean | 32.1% | 18.9% |
| Median | 31.3% | 20.2% |
| Interquartile 25% (IQ1) | 25.9% | 13.1% |
| Interquartile 75% (IQ3) | 39.7% | 25.6% |
| Interquartile Range (IQR) | 13.8% | 12.5% |
| Standard Deviation (Sample) | 12.1% | 8.0% |
| Standard Deviation (Population) | 12.0% | 7.8% |
Similar Demographics by Wage/Income Gap
Demographics Similar to Lithuanians by Wage/Income Gap
In terms of wage/income gap, the demographic groups most similar to Lithuanians are Maltese (28.7%, a difference of 0.010%), Immigrants from Scotland (28.7%, a difference of 0.060%), Belgian (28.8%, a difference of 0.11%), Basque (28.8%, a difference of 0.16%), and French (28.7%, a difference of 0.20%).
| Demographics | Rating | Rank | Wage/Income Gap |
| Macedonians | 0.1 /100 | #309 | Tragic 28.6% |
| Finns | 0.1 /100 | #310 | Tragic 28.6% |
| Immigrants | Lithuania | 0.1 /100 | #311 | Tragic 28.6% |
| Eastern Europeans | 0.1 /100 | #312 | Tragic 28.6% |
| French | 0.1 /100 | #313 | Tragic 28.7% |
| Immigrants | Scotland | 0.1 /100 | #314 | Tragic 28.7% |
| Maltese | 0.1 /100 | #315 | Tragic 28.7% |
| Lithuanians | 0.1 /100 | #316 | Tragic 28.7% |
| Belgians | 0.1 /100 | #317 | Tragic 28.8% |
| Basques | 0.1 /100 | #318 | Tragic 28.8% |
| Slovaks | 0.1 /100 | #319 | Tragic 28.9% |
| British | 0.1 /100 | #320 | Tragic 28.9% |
| Welsh | 0.1 /100 | #321 | Tragic 28.9% |
| Immigrants | Singapore | 0.1 /100 | #322 | Tragic 28.9% |
| Norwegians | 0.1 /100 | #323 | Tragic 29.0% |
Demographics Similar to Pima by Wage/Income Gap
In terms of wage/income gap, the demographic groups most similar to Pima are Immigrants from Bahamas (21.1%, a difference of 0.28%), Immigrants from Yemen (21.1%, a difference of 0.30%), Vietnamese (21.0%, a difference of 0.53%), Somali (21.2%, a difference of 0.55%), and Belizean (21.2%, a difference of 0.57%).
| Demographics | Rating | Rank | Wage/Income Gap |
| Immigrants | Armenia | 100.0 /100 | #27 | Exceptional 20.7% |
| Inupiat | 100.0 /100 | #28 | Exceptional 20.8% |
| Immigrants | Senegal | 100.0 /100 | #29 | Exceptional 20.9% |
| Immigrants | Bangladesh | 100.0 /100 | #30 | Exceptional 20.9% |
| Vietnamese | 100.0 /100 | #31 | Exceptional 21.0% |
| Immigrants | Yemen | 100.0 /100 | #32 | Exceptional 21.1% |
| Immigrants | Bahamas | 100.0 /100 | #33 | Exceptional 21.1% |
| Pima | 100.0 /100 | #34 | Exceptional 21.1% |
| Somalis | 100.0 /100 | #35 | Exceptional 21.2% |
| Belizeans | 100.0 /100 | #36 | Exceptional 21.2% |
| Immigrants | Somalia | 100.0 /100 | #37 | Exceptional 21.2% |
| Immigrants | Belize | 100.0 /100 | #38 | Exceptional 21.3% |
| Colville | 100.0 /100 | #39 | Exceptional 21.3% |
| Lumbee | 100.0 /100 | #40 | Exceptional 21.3% |
| Liberians | 100.0 /100 | #41 | Exceptional 21.4% |