Cherokee vs Immigrants from Ethiopia Wage/Income Gap
COMPARE
Cherokee
Immigrants from Ethiopia
Wage/Income Gap
Wage/Income Gap Comparison
Cherokee
Immigrants from Ethiopia
27.4%
WAGE/INCOME GAP
1.9/ 100
METRIC RATING
256th/ 347
METRIC RANK
21.6%
WAGE/INCOME GAP
100.0/ 100
METRIC RATING
46th/ 347
METRIC RANK
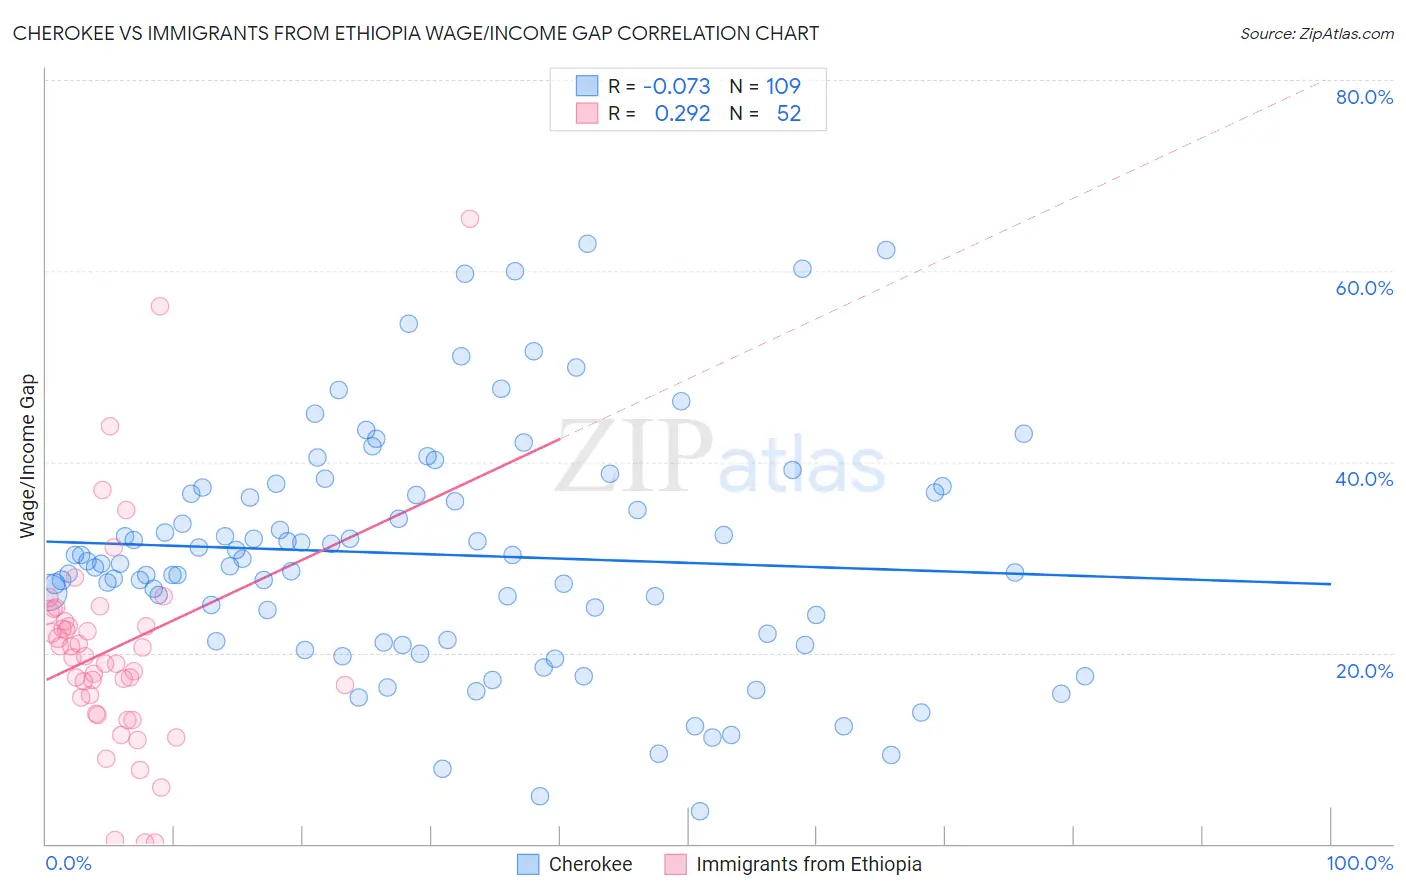
Cherokee vs Immigrants from Ethiopia Wage/Income Gap Correlation Chart
The statistical analysis conducted on geographies consisting of 492,544,110 people shows a slight negative correlation between the proportion of Cherokee and wage/income gap percentage in the United States with a correlation coefficient (R) of -0.073 and weighted average of 27.4%. Similarly, the statistical analysis conducted on geographies consisting of 211,530,252 people shows a weak positive correlation between the proportion of Immigrants from Ethiopia and wage/income gap percentage in the United States with a correlation coefficient (R) of 0.292 and weighted average of 21.6%, a difference of 27.1%.
Wage/Income Gap Correlation Summary
| Measurement | Cherokee | Immigrants from Ethiopia |
| Minimum | 3.4% | 0.11% |
| Maximum | 62.9% | 65.4% |
| Range | 59.5% | 65.3% |
| Mean | 30.3% | 20.5% |
| Median | 29.4% | 19.5% |
| Interquartile 25% (IQ1) | 21.3% | 14.5% |
| Interquartile 75% (IQ3) | 37.1% | 23.8% |
| Interquartile Range (IQR) | 15.8% | 9.4% |
| Standard Deviation (Sample) | 12.4% | 11.7% |
| Standard Deviation (Population) | 12.4% | 11.6% |
Similar Demographics by Wage/Income Gap
Demographics Similar to Cherokee by Wage/Income Gap
In terms of wage/income gap, the demographic groups most similar to Cherokee are Luxembourger (27.4%, a difference of 0.050%), Slavic (27.4%, a difference of 0.090%), Immigrants from France (27.4%, a difference of 0.10%), Israeli (27.4%, a difference of 0.11%), and Icelander (27.5%, a difference of 0.16%).
| Demographics | Rating | Rank | Wage/Income Gap |
| Carpatho Rusyns | 2.7 /100 | #249 | Tragic 27.3% |
| Immigrants | Czechoslovakia | 2.7 /100 | #250 | Tragic 27.3% |
| Immigrants | Norway | 2.5 /100 | #251 | Tragic 27.3% |
| Ukrainians | 2.4 /100 | #252 | Tragic 27.3% |
| Portuguese | 2.2 /100 | #253 | Tragic 27.4% |
| Israelis | 2.1 /100 | #254 | Tragic 27.4% |
| Immigrants | France | 2.1 /100 | #255 | Tragic 27.4% |
| Cherokee | 1.9 /100 | #256 | Tragic 27.4% |
| Luxembourgers | 1.9 /100 | #257 | Tragic 27.4% |
| Slavs | 1.8 /100 | #258 | Tragic 27.4% |
| Icelanders | 1.8 /100 | #259 | Tragic 27.5% |
| Tongans | 1.7 /100 | #260 | Tragic 27.5% |
| Immigrants | Germany | 1.5 /100 | #261 | Tragic 27.5% |
| Immigrants | Lebanon | 1.5 /100 | #262 | Tragic 27.5% |
| Syrians | 1.4 /100 | #263 | Tragic 27.6% |
Demographics Similar to Immigrants from Ethiopia by Wage/Income Gap
In terms of wage/income gap, the demographic groups most similar to Immigrants from Ethiopia are U.S. Virgin Islander (21.5%, a difference of 0.12%), Immigrants from Congo (21.7%, a difference of 0.55%), Immigrants from Eritrea (21.4%, a difference of 0.56%), Sierra Leonean (21.4%, a difference of 0.58%), and Liberian (21.4%, a difference of 0.64%).
| Demographics | Rating | Rank | Wage/Income Gap |
| Colville | 100.0 /100 | #39 | Exceptional 21.3% |
| Lumbee | 100.0 /100 | #40 | Exceptional 21.3% |
| Liberians | 100.0 /100 | #41 | Exceptional 21.4% |
| Immigrants | Sierra Leone | 100.0 /100 | #42 | Exceptional 21.4% |
| Sierra Leoneans | 100.0 /100 | #43 | Exceptional 21.4% |
| Immigrants | Eritrea | 100.0 /100 | #44 | Exceptional 21.4% |
| U.S. Virgin Islanders | 100.0 /100 | #45 | Exceptional 21.5% |
| Immigrants | Ethiopia | 100.0 /100 | #46 | Exceptional 21.6% |
| Immigrants | Congo | 100.0 /100 | #47 | Exceptional 21.7% |
| Blacks/African Americans | 100.0 /100 | #48 | Exceptional 21.7% |
| Ethiopians | 100.0 /100 | #49 | Exceptional 21.8% |
| Immigrants | Western Africa | 100.0 /100 | #50 | Exceptional 22.0% |
| Tohono O'odham | 100.0 /100 | #51 | Exceptional 22.1% |
| Immigrants | Cameroon | 100.0 /100 | #52 | Exceptional 22.2% |
| Bangladeshis | 100.0 /100 | #53 | Exceptional 22.2% |