Canadian vs Fijian Median Household Income
COMPARE
Canadian
Fijian
Median Household Income
Median Household Income Comparison
Canadians
Fijians
$87,769
MEDIAN HOUSEHOLD INCOME
84.7/ 100
METRIC RATING
142nd/ 347
METRIC RANK
$74,205
MEDIAN HOUSEHOLD INCOME
0.1/ 100
METRIC RATING
289th/ 347
METRIC RANK
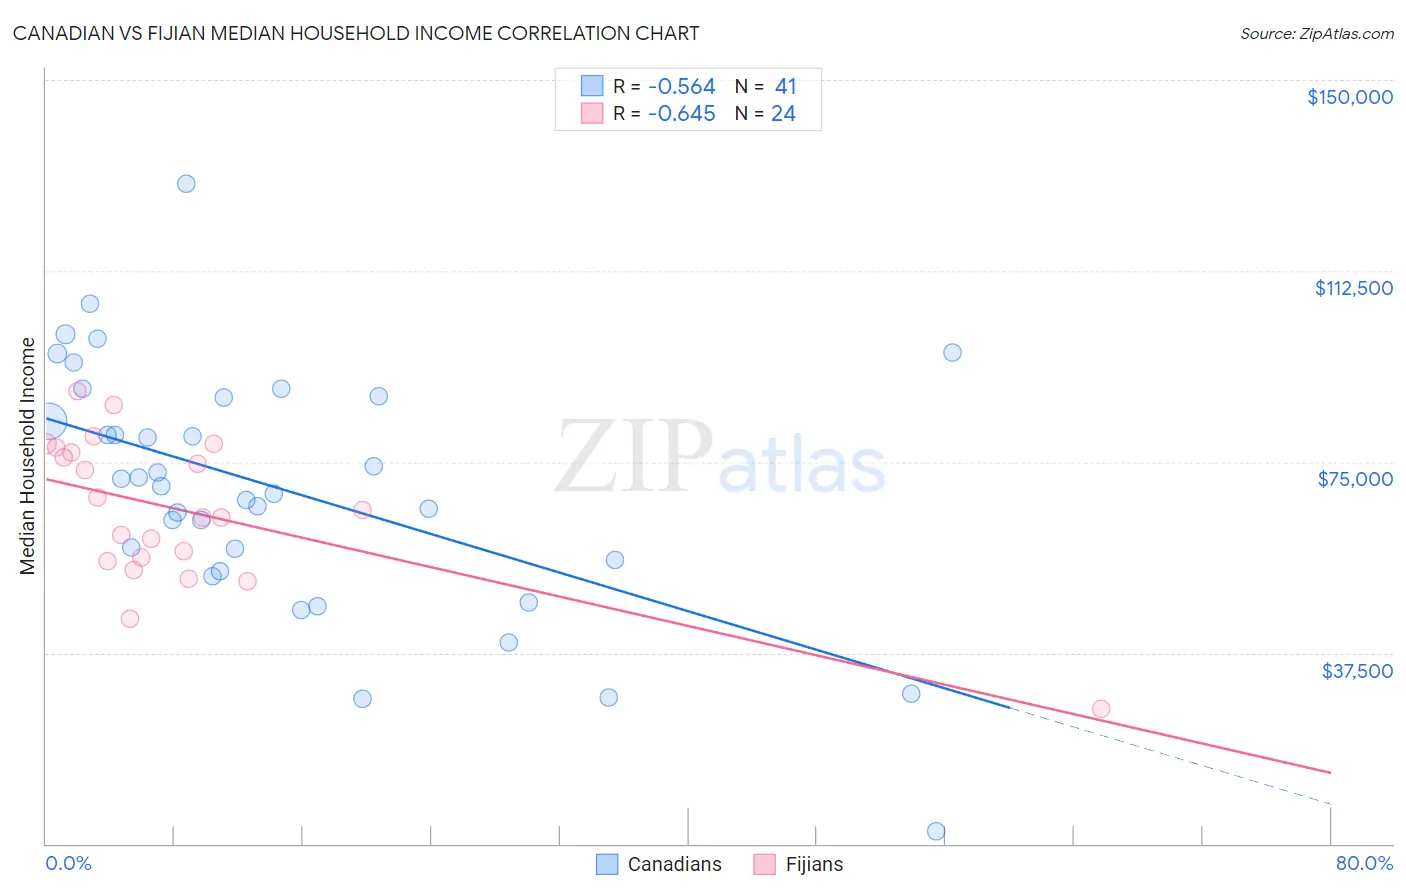
Canadian vs Fijian Median Household Income Correlation Chart
The statistical analysis conducted on geographies consisting of 437,190,973 people shows a substantial negative correlation between the proportion of Canadians and median household income in the United States with a correlation coefficient (R) of -0.564 and weighted average of $87,769. Similarly, the statistical analysis conducted on geographies consisting of 55,947,302 people shows a significant negative correlation between the proportion of Fijians and median household income in the United States with a correlation coefficient (R) of -0.645 and weighted average of $74,205, a difference of 18.3%.
Median Household Income Correlation Summary
| Measurement | Canadian | Fijian |
| Minimum | $2,499 | $26,558 |
| Maximum | $129,644 | $88,892 |
| Range | $127,145 | $62,334 |
| Mean | $69,441 | $65,433 |
| Median | $70,262 | $64,846 |
| Interquartile 25% (IQ1) | $54,608 | $55,875 |
| Interquartile 75% (IQ3) | $87,722 | $77,382 |
| Interquartile Range (IQR) | $33,114 | $21,507 |
| Standard Deviation (Sample) | $24,486 | $14,545 |
| Standard Deviation (Population) | $24,185 | $14,239 |
Similar Demographics by Median Household Income
Demographics Similar to Canadians by Median Household Income
In terms of median household income, the demographic groups most similar to Canadians are Danish ($87,676, a difference of 0.11%), Immigrants from Morocco ($87,930, a difference of 0.18%), Serbian ($87,572, a difference of 0.22%), Ugandan ($87,557, a difference of 0.24%), and Immigrants from Uganda ($87,553, a difference of 0.25%).
| Demographics | Rating | Rank | Median Household Income |
| Immigrants | Sierra Leone | 89.9 /100 | #135 | Excellent $88,498 |
| Poles | 89.7 /100 | #136 | Excellent $88,472 |
| Sierra Leoneans | 89.6 /100 | #137 | Excellent $88,463 |
| Arabs | 89.2 /100 | #138 | Excellent $88,398 |
| Immigrants | Chile | 89.2 /100 | #139 | Excellent $88,388 |
| Lebanese | 87.2 /100 | #140 | Excellent $88,091 |
| Immigrants | Morocco | 86.0 /100 | #141 | Excellent $87,930 |
| Canadians | 84.7 /100 | #142 | Excellent $87,769 |
| Danes | 83.9 /100 | #143 | Excellent $87,676 |
| Serbians | 83.0 /100 | #144 | Excellent $87,572 |
| Ugandans | 82.9 /100 | #145 | Excellent $87,557 |
| Immigrants | Uganda | 82.8 /100 | #146 | Excellent $87,553 |
| South American Indians | 81.8 /100 | #147 | Excellent $87,446 |
| Costa Ricans | 80.0 /100 | #148 | Excellent $87,262 |
| Immigrants | Nepal | 77.7 /100 | #149 | Good $87,046 |
Demographics Similar to Fijians by Median Household Income
In terms of median household income, the demographic groups most similar to Fijians are Immigrants from Central America ($74,217, a difference of 0.020%), Iroquois ($74,279, a difference of 0.10%), Immigrants from Somalia ($74,300, a difference of 0.13%), Bangladeshi ($74,112, a difference of 0.13%), and Mexican ($74,399, a difference of 0.26%).
| Demographics | Rating | Rank | Median Household Income |
| Central American Indians | 0.1 /100 | #282 | Tragic $74,847 |
| Cree | 0.1 /100 | #283 | Tragic $74,685 |
| Yaqui | 0.1 /100 | #284 | Tragic $74,596 |
| Mexicans | 0.1 /100 | #285 | Tragic $74,399 |
| Immigrants | Somalia | 0.1 /100 | #286 | Tragic $74,300 |
| Iroquois | 0.1 /100 | #287 | Tragic $74,279 |
| Immigrants | Central America | 0.1 /100 | #288 | Tragic $74,217 |
| Fijians | 0.1 /100 | #289 | Tragic $74,205 |
| Bangladeshis | 0.1 /100 | #290 | Tragic $74,112 |
| Hispanics or Latinos | 0.1 /100 | #291 | Tragic $73,823 |
| Comanche | 0.1 /100 | #292 | Tragic $73,747 |
| Immigrants | Cabo Verde | 0.1 /100 | #293 | Tragic $73,515 |
| Blackfeet | 0.1 /100 | #294 | Tragic $73,509 |
| Cubans | 0.1 /100 | #295 | Tragic $73,392 |
| Haitians | 0.1 /100 | #296 | Tragic $73,306 |