Sri Lankan vs Fijian Median Household Income
COMPARE
Sri Lankan
Fijian
Median Household Income
Median Household Income Comparison
Sri Lankans
Fijians
$93,093
MEDIAN HOUSEHOLD INCOME
99.4/ 100
METRIC RATING
79th/ 347
METRIC RANK
$74,205
MEDIAN HOUSEHOLD INCOME
0.1/ 100
METRIC RATING
289th/ 347
METRIC RANK
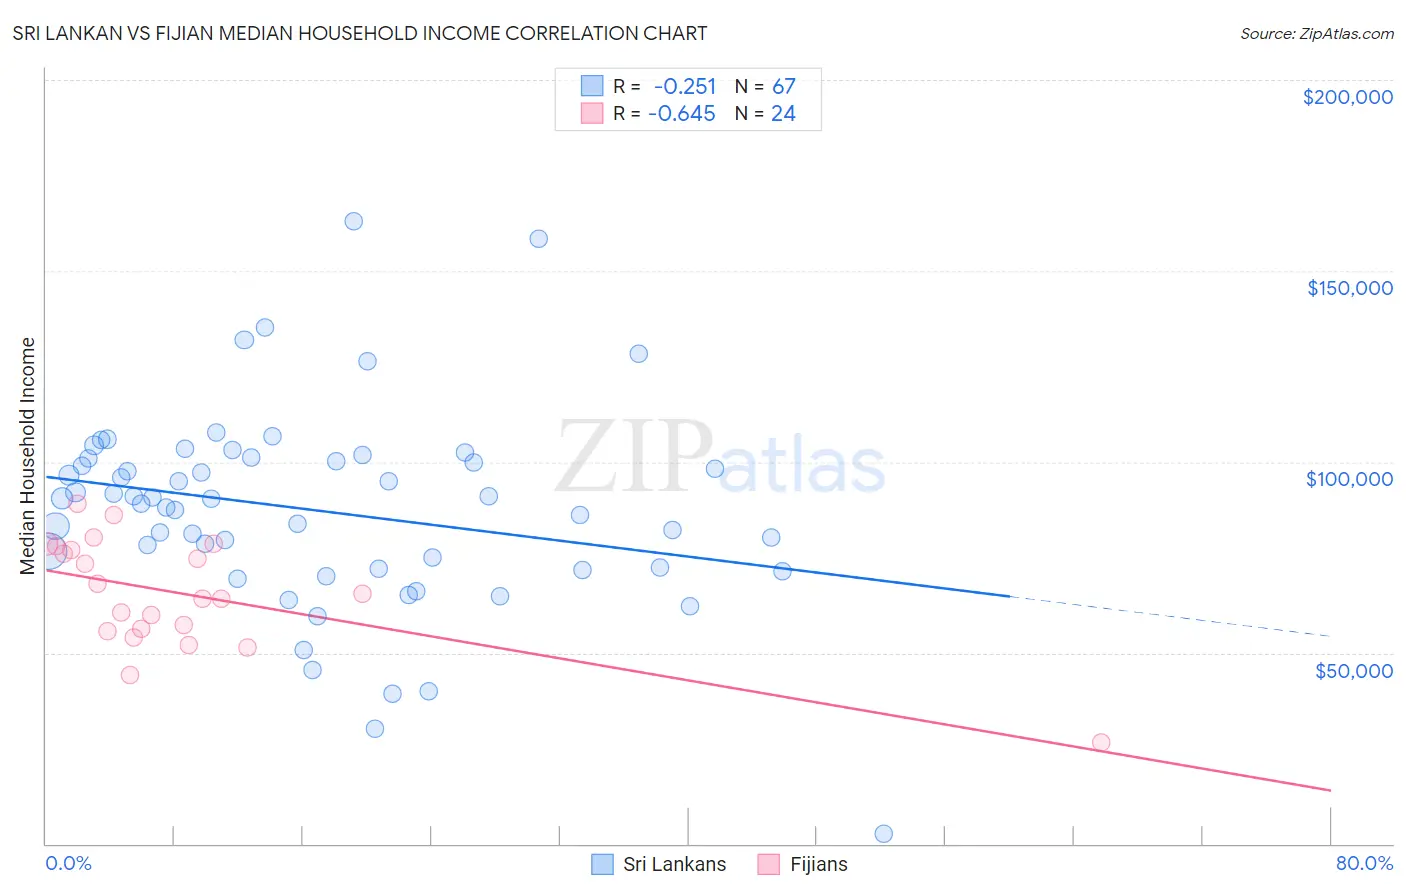
Sri Lankan vs Fijian Median Household Income Correlation Chart
The statistical analysis conducted on geographies consisting of 439,964,424 people shows a weak negative correlation between the proportion of Sri Lankans and median household income in the United States with a correlation coefficient (R) of -0.251 and weighted average of $93,093. Similarly, the statistical analysis conducted on geographies consisting of 55,947,302 people shows a significant negative correlation between the proportion of Fijians and median household income in the United States with a correlation coefficient (R) of -0.645 and weighted average of $74,205, a difference of 25.5%.
Median Household Income Correlation Summary
| Measurement | Sri Lankan | Fijian |
| Minimum | $2,499 | $26,558 |
| Maximum | $163,019 | $88,892 |
| Range | $160,520 | $62,334 |
| Mean | $87,249 | $65,433 |
| Median | $90,272 | $64,846 |
| Interquartile 25% (IQ1) | $71,944 | $55,875 |
| Interquartile 75% (IQ3) | $100,934 | $77,382 |
| Interquartile Range (IQR) | $28,990 | $21,507 |
| Standard Deviation (Sample) | $26,489 | $14,545 |
| Standard Deviation (Population) | $26,291 | $14,239 |
Similar Demographics by Median Household Income
Demographics Similar to Sri Lankans by Median Household Income
In terms of median household income, the demographic groups most similar to Sri Lankans are Tongan ($93,076, a difference of 0.020%), Immigrants from Eastern Europe ($93,051, a difference of 0.050%), Immigrants from Bulgaria ($93,148, a difference of 0.060%), Immigrants from Afghanistan ($93,375, a difference of 0.30%), and South African ($93,379, a difference of 0.31%).
| Demographics | Rating | Rank | Median Household Income |
| Lithuanians | 99.6 /100 | #72 | Exceptional $93,852 |
| Immigrants | Egypt | 99.6 /100 | #73 | Exceptional $93,700 |
| Immigrants | Latvia | 99.6 /100 | #74 | Exceptional $93,602 |
| Immigrants | Italy | 99.5 /100 | #75 | Exceptional $93,465 |
| South Africans | 99.5 /100 | #76 | Exceptional $93,379 |
| Immigrants | Afghanistan | 99.5 /100 | #77 | Exceptional $93,375 |
| Immigrants | Bulgaria | 99.4 /100 | #78 | Exceptional $93,148 |
| Sri Lankans | 99.4 /100 | #79 | Exceptional $93,093 |
| Tongans | 99.4 /100 | #80 | Exceptional $93,076 |
| Immigrants | Eastern Europe | 99.4 /100 | #81 | Exceptional $93,051 |
| Immigrants | Spain | 99.3 /100 | #82 | Exceptional $92,732 |
| Italians | 99.1 /100 | #83 | Exceptional $92,475 |
| Immigrants | Argentina | 99.1 /100 | #84 | Exceptional $92,417 |
| Immigrants | Croatia | 99.0 /100 | #85 | Exceptional $92,225 |
| Immigrants | England | 98.9 /100 | #86 | Exceptional $92,098 |
Demographics Similar to Fijians by Median Household Income
In terms of median household income, the demographic groups most similar to Fijians are Immigrants from Central America ($74,217, a difference of 0.020%), Iroquois ($74,279, a difference of 0.10%), Immigrants from Somalia ($74,300, a difference of 0.13%), Bangladeshi ($74,112, a difference of 0.13%), and Mexican ($74,399, a difference of 0.26%).
| Demographics | Rating | Rank | Median Household Income |
| Central American Indians | 0.1 /100 | #282 | Tragic $74,847 |
| Cree | 0.1 /100 | #283 | Tragic $74,685 |
| Yaqui | 0.1 /100 | #284 | Tragic $74,596 |
| Mexicans | 0.1 /100 | #285 | Tragic $74,399 |
| Immigrants | Somalia | 0.1 /100 | #286 | Tragic $74,300 |
| Iroquois | 0.1 /100 | #287 | Tragic $74,279 |
| Immigrants | Central America | 0.1 /100 | #288 | Tragic $74,217 |
| Fijians | 0.1 /100 | #289 | Tragic $74,205 |
| Bangladeshis | 0.1 /100 | #290 | Tragic $74,112 |
| Hispanics or Latinos | 0.1 /100 | #291 | Tragic $73,823 |
| Comanche | 0.1 /100 | #292 | Tragic $73,747 |
| Immigrants | Cabo Verde | 0.1 /100 | #293 | Tragic $73,515 |
| Blackfeet | 0.1 /100 | #294 | Tragic $73,509 |
| Cubans | 0.1 /100 | #295 | Tragic $73,392 |
| Haitians | 0.1 /100 | #296 | Tragic $73,306 |