Nigerian vs Fijian Median Household Income
COMPARE
Nigerian
Fijian
Median Household Income
Median Household Income Comparison
Nigerians
Fijians
$81,725
MEDIAN HOUSEHOLD INCOME
10.3/ 100
METRIC RATING
219th/ 347
METRIC RANK
$74,205
MEDIAN HOUSEHOLD INCOME
0.1/ 100
METRIC RATING
289th/ 347
METRIC RANK
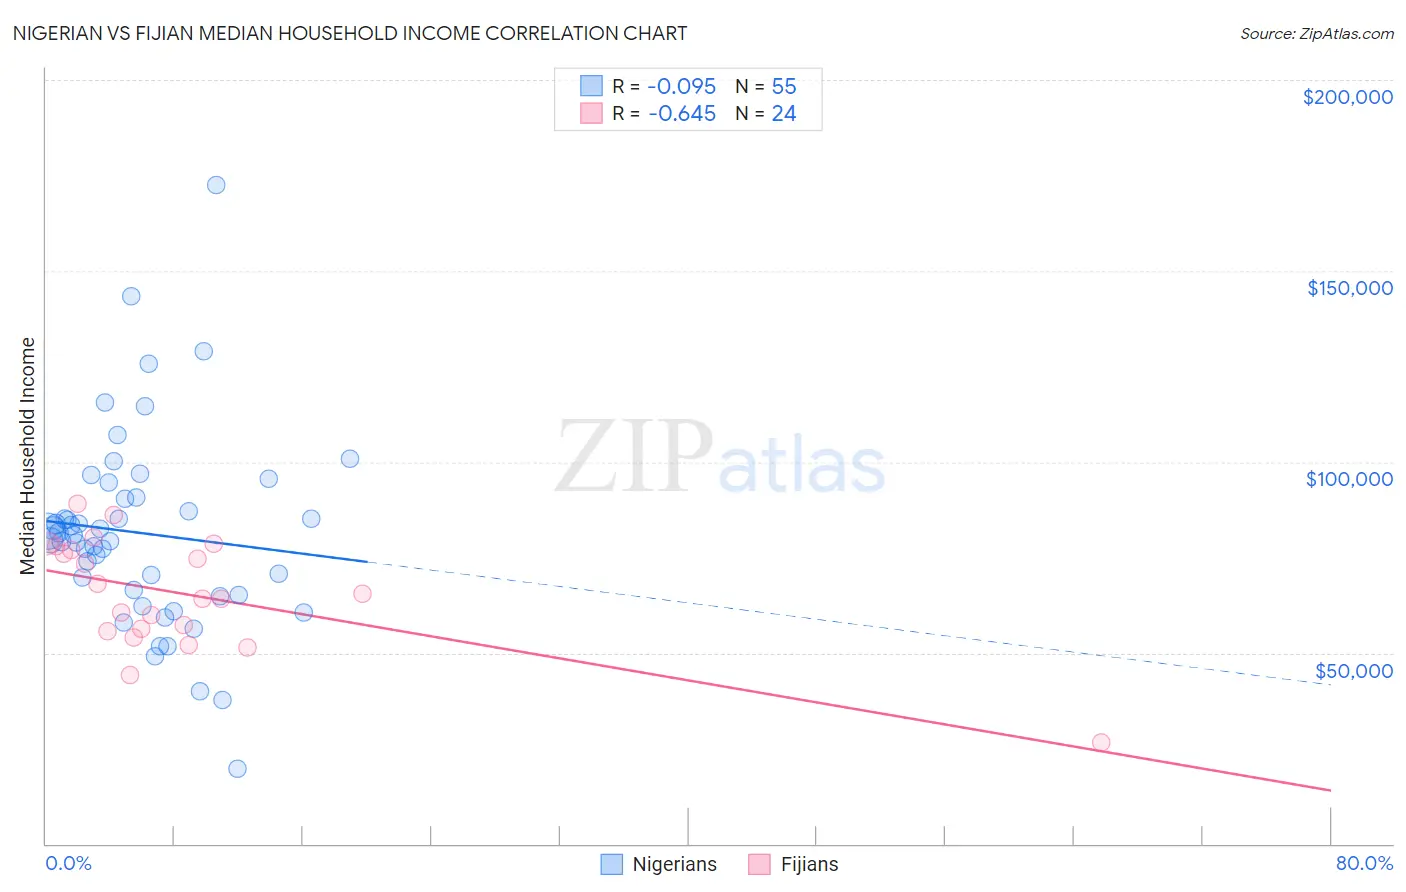
Nigerian vs Fijian Median Household Income Correlation Chart
The statistical analysis conducted on geographies consisting of 332,385,010 people shows a slight negative correlation between the proportion of Nigerians and median household income in the United States with a correlation coefficient (R) of -0.095 and weighted average of $81,725. Similarly, the statistical analysis conducted on geographies consisting of 55,947,302 people shows a significant negative correlation between the proportion of Fijians and median household income in the United States with a correlation coefficient (R) of -0.645 and weighted average of $74,205, a difference of 10.1%.
Median Household Income Correlation Summary
| Measurement | Nigerian | Fijian |
| Minimum | $19,722 | $26,558 |
| Maximum | $172,388 | $88,892 |
| Range | $152,666 | $62,334 |
| Mean | $81,339 | $65,433 |
| Median | $80,919 | $64,846 |
| Interquartile 25% (IQ1) | $65,240 | $55,875 |
| Interquartile 75% (IQ3) | $90,601 | $77,382 |
| Interquartile Range (IQR) | $25,361 | $21,507 |
| Standard Deviation (Sample) | $25,635 | $14,545 |
| Standard Deviation (Population) | $25,401 | $14,239 |
Similar Demographics by Median Household Income
Demographics Similar to Nigerians by Median Household Income
In terms of median household income, the demographic groups most similar to Nigerians are Immigrants from Venezuela ($81,506, a difference of 0.27%), Immigrants from Ghana ($81,489, a difference of 0.29%), White/Caucasian ($82,029, a difference of 0.37%), Ecuadorian ($82,070, a difference of 0.42%), and Yugoslavian ($82,186, a difference of 0.56%).
| Demographics | Rating | Rank | Median Household Income |
| Venezuelans | 15.3 /100 | #212 | Poor $82,432 |
| Nepalese | 15.1 /100 | #213 | Poor $82,410 |
| Panamanians | 14.0 /100 | #214 | Poor $82,272 |
| Vietnamese | 13.8 /100 | #215 | Poor $82,248 |
| Yugoslavians | 13.3 /100 | #216 | Poor $82,186 |
| Ecuadorians | 12.5 /100 | #217 | Poor $82,070 |
| Whites/Caucasians | 12.2 /100 | #218 | Poor $82,029 |
| Nigerians | 10.3 /100 | #219 | Poor $81,725 |
| Immigrants | Venezuela | 9.0 /100 | #220 | Tragic $81,506 |
| Immigrants | Ghana | 9.0 /100 | #221 | Tragic $81,489 |
| Immigrants | Nigeria | 7.7 /100 | #222 | Tragic $81,236 |
| Immigrants | El Salvador | 7.6 /100 | #223 | Tragic $81,213 |
| Malaysians | 7.0 /100 | #224 | Tragic $81,064 |
| Scotch-Irish | 6.6 /100 | #225 | Tragic $80,972 |
| Immigrants | Panama | 6.2 /100 | #226 | Tragic $80,873 |
Demographics Similar to Fijians by Median Household Income
In terms of median household income, the demographic groups most similar to Fijians are Immigrants from Central America ($74,217, a difference of 0.020%), Iroquois ($74,279, a difference of 0.10%), Immigrants from Somalia ($74,300, a difference of 0.13%), Bangladeshi ($74,112, a difference of 0.13%), and Mexican ($74,399, a difference of 0.26%).
| Demographics | Rating | Rank | Median Household Income |
| Central American Indians | 0.1 /100 | #282 | Tragic $74,847 |
| Cree | 0.1 /100 | #283 | Tragic $74,685 |
| Yaqui | 0.1 /100 | #284 | Tragic $74,596 |
| Mexicans | 0.1 /100 | #285 | Tragic $74,399 |
| Immigrants | Somalia | 0.1 /100 | #286 | Tragic $74,300 |
| Iroquois | 0.1 /100 | #287 | Tragic $74,279 |
| Immigrants | Central America | 0.1 /100 | #288 | Tragic $74,217 |
| Fijians | 0.1 /100 | #289 | Tragic $74,205 |
| Bangladeshis | 0.1 /100 | #290 | Tragic $74,112 |
| Hispanics or Latinos | 0.1 /100 | #291 | Tragic $73,823 |
| Comanche | 0.1 /100 | #292 | Tragic $73,747 |
| Immigrants | Cabo Verde | 0.1 /100 | #293 | Tragic $73,515 |
| Blackfeet | 0.1 /100 | #294 | Tragic $73,509 |
| Cubans | 0.1 /100 | #295 | Tragic $73,392 |
| Haitians | 0.1 /100 | #296 | Tragic $73,306 |