Hmong vs Fijian Median Household Income
COMPARE
Hmong
Fijian
Median Household Income
Median Household Income Comparison
Hmong
Fijians
$75,839
MEDIAN HOUSEHOLD INCOME
0.3/ 100
METRIC RATING
270th/ 347
METRIC RANK
$74,205
MEDIAN HOUSEHOLD INCOME
0.1/ 100
METRIC RATING
289th/ 347
METRIC RANK
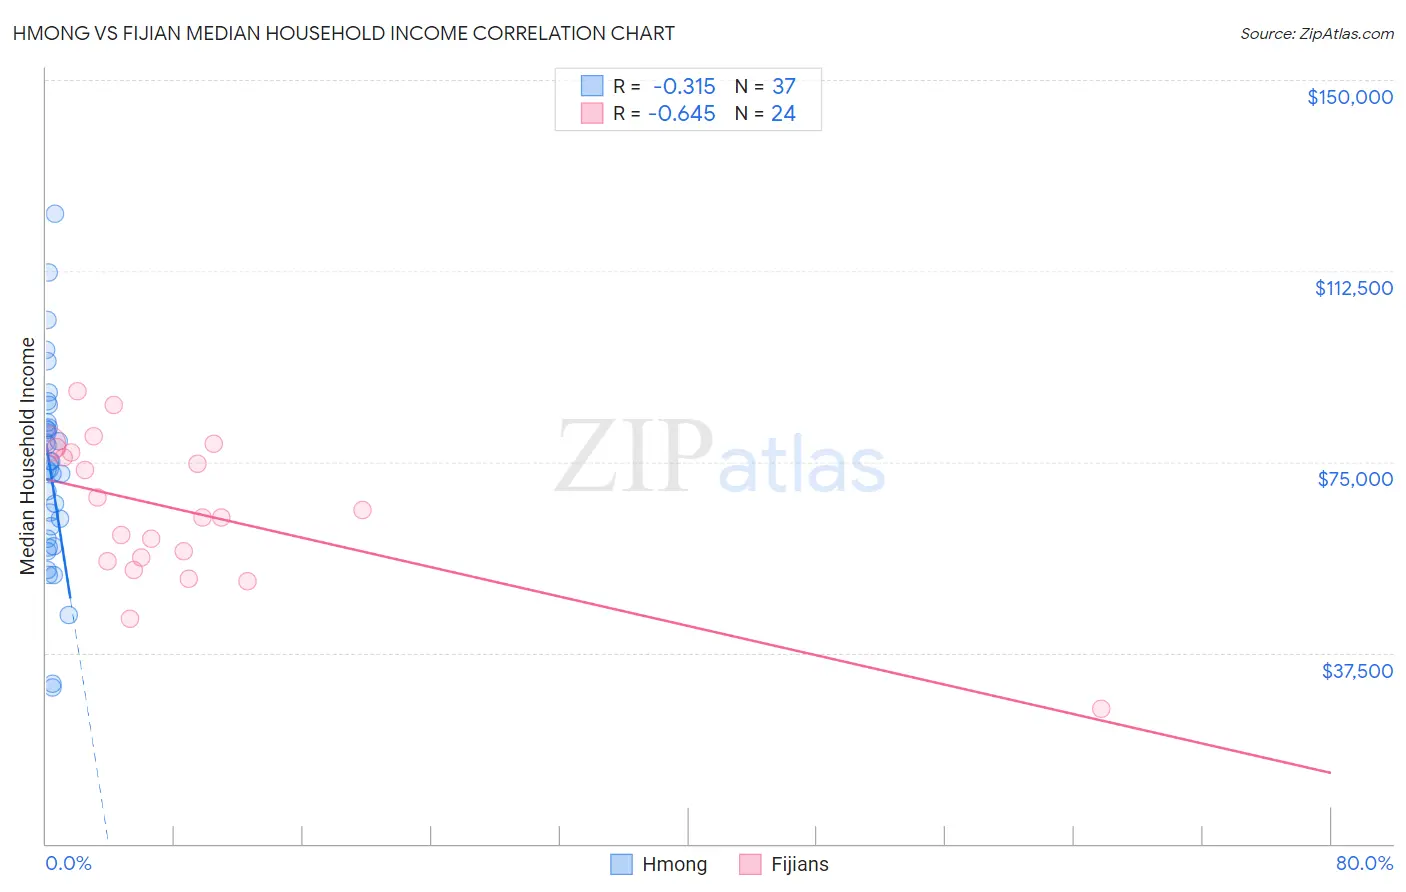
Hmong vs Fijian Median Household Income Correlation Chart
The statistical analysis conducted on geographies consisting of 24,655,529 people shows a mild negative correlation between the proportion of Hmong and median household income in the United States with a correlation coefficient (R) of -0.315 and weighted average of $75,839. Similarly, the statistical analysis conducted on geographies consisting of 55,947,302 people shows a significant negative correlation between the proportion of Fijians and median household income in the United States with a correlation coefficient (R) of -0.645 and weighted average of $74,205, a difference of 2.2%.
Median Household Income Correlation Summary
| Measurement | Hmong | Fijian |
| Minimum | $30,679 | $26,558 |
| Maximum | $123,750 | $88,892 |
| Range | $93,071 | $62,334 |
| Mean | $73,160 | $65,433 |
| Median | $73,828 | $64,846 |
| Interquartile 25% (IQ1) | $59,130 | $55,875 |
| Interquartile 75% (IQ3) | $82,249 | $77,382 |
| Interquartile Range (IQR) | $23,119 | $21,507 |
| Standard Deviation (Sample) | $19,589 | $14,545 |
| Standard Deviation (Population) | $19,322 | $14,239 |
Demographics Similar to Hmong and Fijians by Median Household Income
In terms of median household income, the demographic groups most similar to Hmong are Cape Verdean ($75,848, a difference of 0.010%), Pennsylvania German ($75,814, a difference of 0.030%), Somali ($75,782, a difference of 0.080%), Liberian ($75,667, a difference of 0.23%), and British West Indian ($75,647, a difference of 0.25%). Similarly, the demographic groups most similar to Fijians are Immigrants from Central America ($74,217, a difference of 0.020%), Iroquois ($74,279, a difference of 0.10%), Immigrants from Somalia ($74,300, a difference of 0.13%), Mexican ($74,399, a difference of 0.26%), and Yaqui ($74,596, a difference of 0.53%).
| Demographics | Rating | Rank | Median Household Income |
| Cape Verdeans | 0.3 /100 | #269 | Tragic $75,848 |
| Hmong | 0.3 /100 | #270 | Tragic $75,839 |
| Pennsylvania Germans | 0.3 /100 | #271 | Tragic $75,814 |
| Somalis | 0.3 /100 | #272 | Tragic $75,782 |
| Liberians | 0.2 /100 | #273 | Tragic $75,667 |
| British West Indians | 0.2 /100 | #274 | Tragic $75,647 |
| Immigrants | Micronesia | 0.2 /100 | #275 | Tragic $75,574 |
| Immigrants | Latin America | 0.2 /100 | #276 | Tragic $75,420 |
| Spanish Americans | 0.2 /100 | #277 | Tragic $75,386 |
| Osage | 0.2 /100 | #278 | Tragic $75,240 |
| Immigrants | Guatemala | 0.2 /100 | #279 | Tragic $75,123 |
| Senegalese | 0.2 /100 | #280 | Tragic $74,999 |
| Immigrants | Liberia | 0.1 /100 | #281 | Tragic $74,896 |
| Central American Indians | 0.1 /100 | #282 | Tragic $74,847 |
| Cree | 0.1 /100 | #283 | Tragic $74,685 |
| Yaqui | 0.1 /100 | #284 | Tragic $74,596 |
| Mexicans | 0.1 /100 | #285 | Tragic $74,399 |
| Immigrants | Somalia | 0.1 /100 | #286 | Tragic $74,300 |
| Iroquois | 0.1 /100 | #287 | Tragic $74,279 |
| Immigrants | Central America | 0.1 /100 | #288 | Tragic $74,217 |
| Fijians | 0.1 /100 | #289 | Tragic $74,205 |