Canadian vs Immigrants from Sweden Median Household Income
COMPARE
Canadian
Immigrants from Sweden
Median Household Income
Median Household Income Comparison
Canadians
Immigrants from Sweden
$87,769
MEDIAN HOUSEHOLD INCOME
84.7/ 100
METRIC RATING
142nd/ 347
METRIC RANK
$100,699
MEDIAN HOUSEHOLD INCOME
100.0/ 100
METRIC RATING
25th/ 347
METRIC RANK
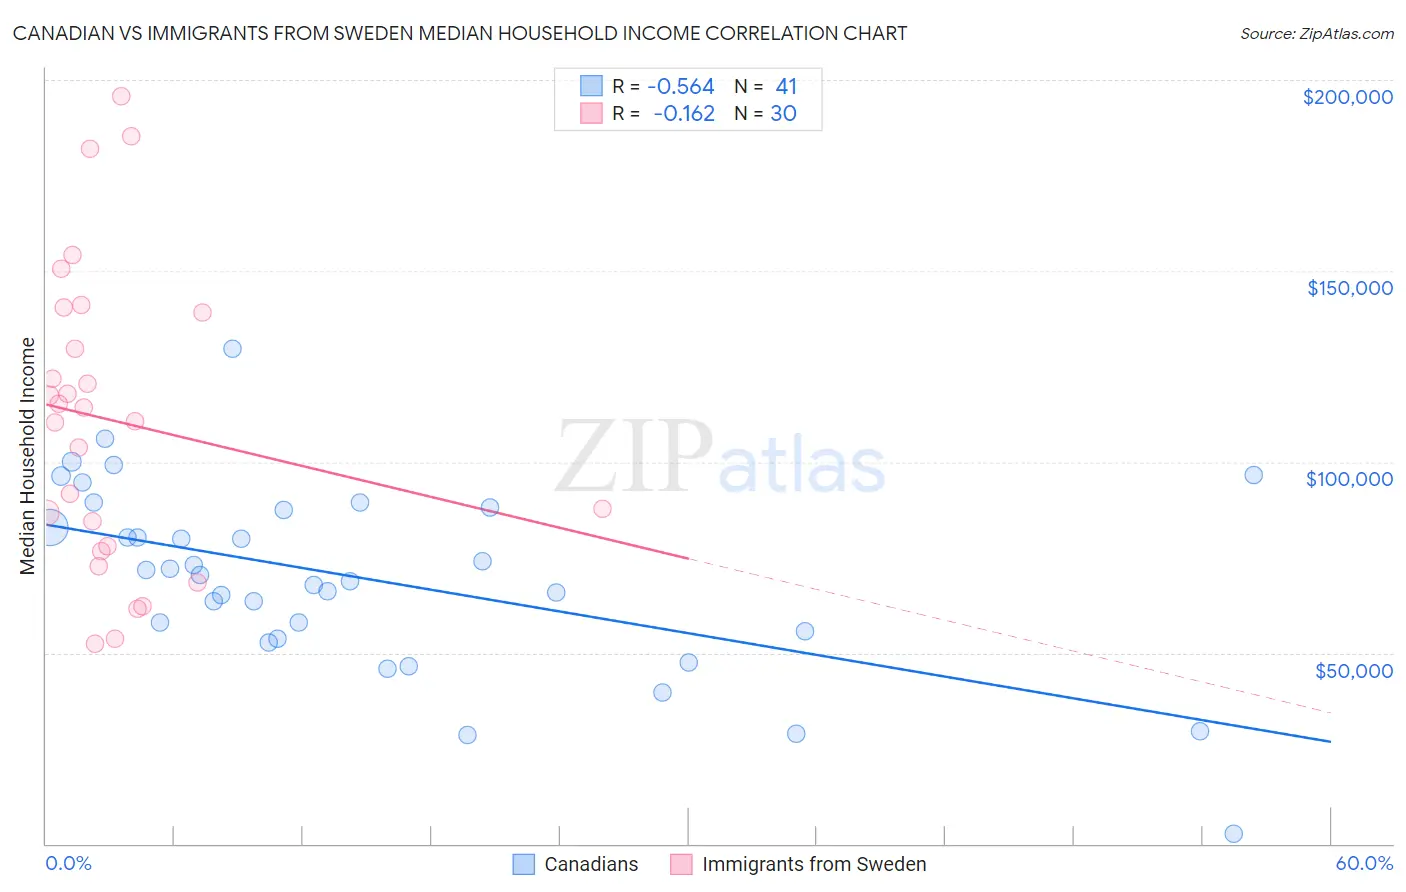
Canadian vs Immigrants from Sweden Median Household Income Correlation Chart
The statistical analysis conducted on geographies consisting of 437,190,973 people shows a substantial negative correlation between the proportion of Canadians and median household income in the United States with a correlation coefficient (R) of -0.564 and weighted average of $87,769. Similarly, the statistical analysis conducted on geographies consisting of 164,698,337 people shows a poor negative correlation between the proportion of Immigrants from Sweden and median household income in the United States with a correlation coefficient (R) of -0.162 and weighted average of $100,699, a difference of 14.7%.
Median Household Income Correlation Summary
| Measurement | Canadian | Immigrants from Sweden |
| Minimum | $2,499 | $52,323 |
| Maximum | $129,644 | $195,586 |
| Range | $127,145 | $143,263 |
| Mean | $69,441 | $110,867 |
| Median | $70,262 | $112,526 |
| Interquartile 25% (IQ1) | $54,608 | $78,036 |
| Interquartile 75% (IQ3) | $87,722 | $139,219 |
| Interquartile Range (IQR) | $33,114 | $61,183 |
| Standard Deviation (Sample) | $24,486 | $38,839 |
| Standard Deviation (Population) | $24,185 | $38,186 |
Similar Demographics by Median Household Income
Demographics Similar to Canadians by Median Household Income
In terms of median household income, the demographic groups most similar to Canadians are Danish ($87,676, a difference of 0.11%), Immigrants from Morocco ($87,930, a difference of 0.18%), Serbian ($87,572, a difference of 0.22%), Ugandan ($87,557, a difference of 0.24%), and Immigrants from Uganda ($87,553, a difference of 0.25%).
| Demographics | Rating | Rank | Median Household Income |
| Immigrants | Sierra Leone | 89.9 /100 | #135 | Excellent $88,498 |
| Poles | 89.7 /100 | #136 | Excellent $88,472 |
| Sierra Leoneans | 89.6 /100 | #137 | Excellent $88,463 |
| Arabs | 89.2 /100 | #138 | Excellent $88,398 |
| Immigrants | Chile | 89.2 /100 | #139 | Excellent $88,388 |
| Lebanese | 87.2 /100 | #140 | Excellent $88,091 |
| Immigrants | Morocco | 86.0 /100 | #141 | Excellent $87,930 |
| Canadians | 84.7 /100 | #142 | Excellent $87,769 |
| Danes | 83.9 /100 | #143 | Excellent $87,676 |
| Serbians | 83.0 /100 | #144 | Excellent $87,572 |
| Ugandans | 82.9 /100 | #145 | Excellent $87,557 |
| Immigrants | Uganda | 82.8 /100 | #146 | Excellent $87,553 |
| South American Indians | 81.8 /100 | #147 | Excellent $87,446 |
| Costa Ricans | 80.0 /100 | #148 | Excellent $87,262 |
| Immigrants | Nepal | 77.7 /100 | #149 | Good $87,046 |
Demographics Similar to Immigrants from Sweden by Median Household Income
In terms of median household income, the demographic groups most similar to Immigrants from Sweden are Immigrants from Japan ($100,711, a difference of 0.010%), Immigrants from Belgium ($100,306, a difference of 0.39%), Bhutanese ($100,151, a difference of 0.55%), Immigrants from Bolivia ($101,394, a difference of 0.69%), and Immigrants from Sri Lanka ($99,943, a difference of 0.76%).
| Demographics | Rating | Rank | Median Household Income |
| Cypriots | 100.0 /100 | #18 | Exceptional $102,843 |
| Immigrants | Australia | 100.0 /100 | #19 | Exceptional $102,562 |
| Bolivians | 100.0 /100 | #20 | Exceptional $102,195 |
| Eastern Europeans | 100.0 /100 | #21 | Exceptional $101,781 |
| Asians | 100.0 /100 | #22 | Exceptional $101,681 |
| Immigrants | Bolivia | 100.0 /100 | #23 | Exceptional $101,394 |
| Immigrants | Japan | 100.0 /100 | #24 | Exceptional $100,711 |
| Immigrants | Sweden | 100.0 /100 | #25 | Exceptional $100,699 |
| Immigrants | Belgium | 100.0 /100 | #26 | Exceptional $100,306 |
| Bhutanese | 100.0 /100 | #27 | Exceptional $100,151 |
| Immigrants | Sri Lanka | 100.0 /100 | #28 | Exceptional $99,943 |
| Immigrants | Asia | 100.0 /100 | #29 | Exceptional $99,933 |
| Immigrants | Northern Europe | 100.0 /100 | #30 | Exceptional $99,813 |
| Turks | 100.0 /100 | #31 | Exceptional $99,389 |
| Immigrants | Denmark | 100.0 /100 | #32 | Exceptional $98,510 |