Canadian vs Immigrants from Armenia Median Household Income
COMPARE
Canadian
Immigrants from Armenia
Median Household Income
Median Household Income Comparison
Canadians
Immigrants from Armenia
$87,769
MEDIAN HOUSEHOLD INCOME
84.7/ 100
METRIC RATING
142nd/ 347
METRIC RANK
$83,555
MEDIAN HOUSEHOLD INCOME
27.0/ 100
METRIC RATING
195th/ 347
METRIC RANK
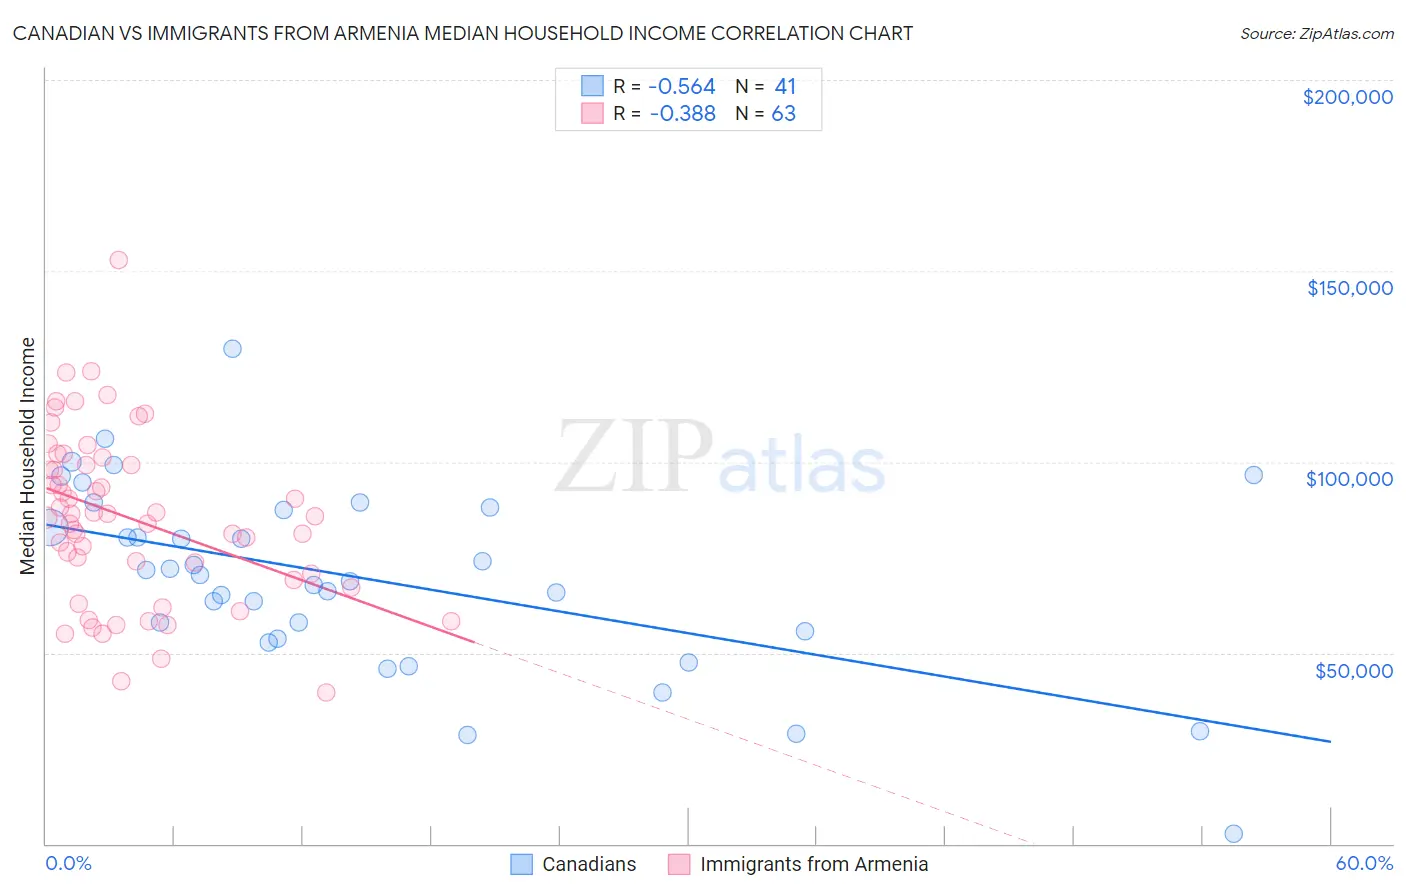
Canadian vs Immigrants from Armenia Median Household Income Correlation Chart
The statistical analysis conducted on geographies consisting of 437,190,973 people shows a substantial negative correlation between the proportion of Canadians and median household income in the United States with a correlation coefficient (R) of -0.564 and weighted average of $87,769. Similarly, the statistical analysis conducted on geographies consisting of 97,712,518 people shows a mild negative correlation between the proportion of Immigrants from Armenia and median household income in the United States with a correlation coefficient (R) of -0.388 and weighted average of $83,555, a difference of 5.0%.
Median Household Income Correlation Summary
| Measurement | Canadian | Immigrants from Armenia |
| Minimum | $2,499 | $39,713 |
| Maximum | $129,644 | $152,803 |
| Range | $127,145 | $113,090 |
| Mean | $69,441 | $85,202 |
| Median | $70,262 | $85,651 |
| Interquartile 25% (IQ1) | $54,608 | $69,102 |
| Interquartile 75% (IQ3) | $87,722 | $99,318 |
| Interquartile Range (IQR) | $33,114 | $30,216 |
| Standard Deviation (Sample) | $24,486 | $22,242 |
| Standard Deviation (Population) | $24,185 | $22,064 |
Similar Demographics by Median Household Income
Demographics Similar to Canadians by Median Household Income
In terms of median household income, the demographic groups most similar to Canadians are Danish ($87,676, a difference of 0.11%), Immigrants from Morocco ($87,930, a difference of 0.18%), Serbian ($87,572, a difference of 0.22%), Ugandan ($87,557, a difference of 0.24%), and Immigrants from Uganda ($87,553, a difference of 0.25%).
| Demographics | Rating | Rank | Median Household Income |
| Immigrants | Sierra Leone | 89.9 /100 | #135 | Excellent $88,498 |
| Poles | 89.7 /100 | #136 | Excellent $88,472 |
| Sierra Leoneans | 89.6 /100 | #137 | Excellent $88,463 |
| Arabs | 89.2 /100 | #138 | Excellent $88,398 |
| Immigrants | Chile | 89.2 /100 | #139 | Excellent $88,388 |
| Lebanese | 87.2 /100 | #140 | Excellent $88,091 |
| Immigrants | Morocco | 86.0 /100 | #141 | Excellent $87,930 |
| Canadians | 84.7 /100 | #142 | Excellent $87,769 |
| Danes | 83.9 /100 | #143 | Excellent $87,676 |
| Serbians | 83.0 /100 | #144 | Excellent $87,572 |
| Ugandans | 82.9 /100 | #145 | Excellent $87,557 |
| Immigrants | Uganda | 82.8 /100 | #146 | Excellent $87,553 |
| South American Indians | 81.8 /100 | #147 | Excellent $87,446 |
| Costa Ricans | 80.0 /100 | #148 | Excellent $87,262 |
| Immigrants | Nepal | 77.7 /100 | #149 | Good $87,046 |
Demographics Similar to Immigrants from Armenia by Median Household Income
In terms of median household income, the demographic groups most similar to Immigrants from Armenia are Ghanaian ($83,582, a difference of 0.030%), Finnish ($83,607, a difference of 0.060%), Welsh ($83,628, a difference of 0.090%), French ($83,468, a difference of 0.10%), and Aleut ($83,446, a difference of 0.13%).
| Demographics | Rating | Rank | Median Household Income |
| Tlingit-Haida | 32.6 /100 | #188 | Fair $83,968 |
| Immigrants | Colombia | 31.7 /100 | #189 | Fair $83,902 |
| Slovaks | 30.2 /100 | #190 | Fair $83,798 |
| Iraqis | 29.6 /100 | #191 | Fair $83,753 |
| Welsh | 28.0 /100 | #192 | Fair $83,628 |
| Finns | 27.7 /100 | #193 | Fair $83,607 |
| Ghanaians | 27.4 /100 | #194 | Fair $83,582 |
| Immigrants | Armenia | 27.0 /100 | #195 | Fair $83,555 |
| French | 26.0 /100 | #196 | Fair $83,468 |
| Aleuts | 25.7 /100 | #197 | Fair $83,446 |
| Japanese | 25.1 /100 | #198 | Fair $83,395 |
| Germans | 24.6 /100 | #199 | Fair $83,358 |
| Tsimshian | 24.5 /100 | #200 | Fair $83,346 |
| Spanish | 24.4 /100 | #201 | Fair $83,343 |
| Immigrants | Thailand | 24.3 /100 | #202 | Fair $83,327 |