Zip Codes with the Highest Percentage of Population Employed in Installation, Maintenance & Repair in Marion, IN
RELATED REPORTS & OPTIONS
Installation, Maintenance & Repair
Marion
Compare Zip Codes
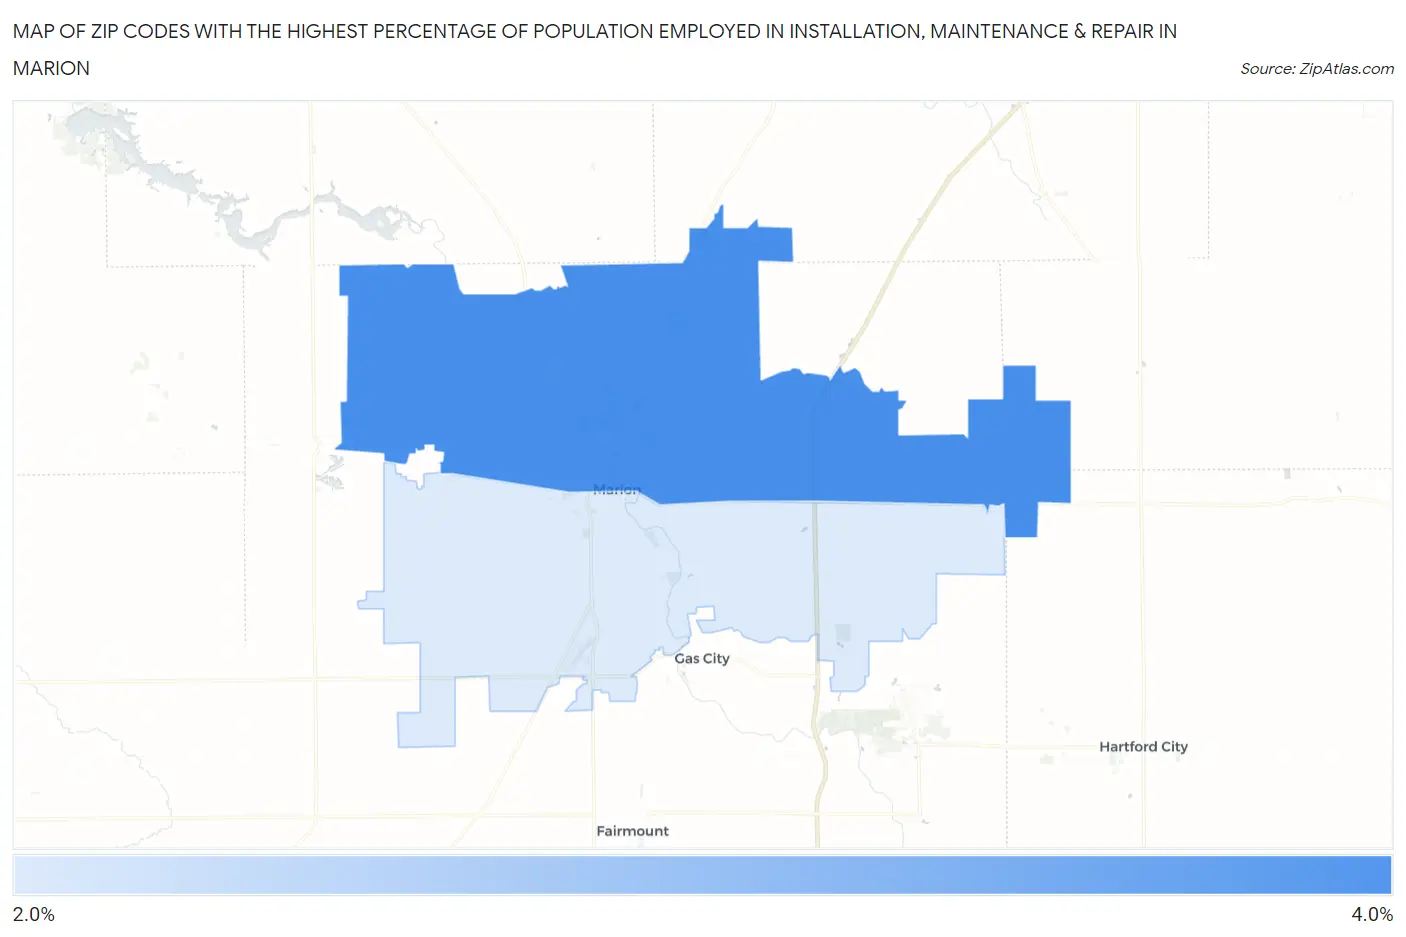
Map of Zip Codes with the Highest Percentage of Population Employed in Installation, Maintenance & Repair in Marion
2.9%
4.0%
Zip Codes with the Highest Percentage of Population Employed in Installation, Maintenance & Repair in Marion, IN
| Zip Code | % Employed | vs State | vs National | |
| 1. | 46952 | 4.0% | 3.5%(+0.430)#376 | 3.1%(+0.904)#12,483 |
| 2. | 46953 | 2.9% | 3.5%(-0.650)#494 | 3.1%(-0.176)#17,541 |
1
Common Questions
What are the Top Zip Codes with the Highest Percentage of Population Employed in Installation, Maintenance & Repair in Marion, IN?
Top Zip Codes with the Highest Percentage of Population Employed in Installation, Maintenance & Repair in Marion, IN are:
What zip code has the Highest Percentage of Population Employed in Installation, Maintenance & Repair in Marion, IN?
46952 has the Highest Percentage of Population Employed in Installation, Maintenance & Repair in Marion, IN with 4.0%.
What is the Percentage of Population Employed in Installation, Maintenance & Repair in Indiana?
Percentage of Population Employed in Installation, Maintenance & Repair in Indiana is 3.5%.
What is the Percentage of Population Employed in Installation, Maintenance & Repair in the United States?
Percentage of Population Employed in Installation, Maintenance & Repair in the United States is 3.1%.