Zip Codes with the Highest Percentage of Population Employed in Security & Protection in Marion, IN
RELATED REPORTS & OPTIONS
Security & Protection
Marion
Compare Zip Codes
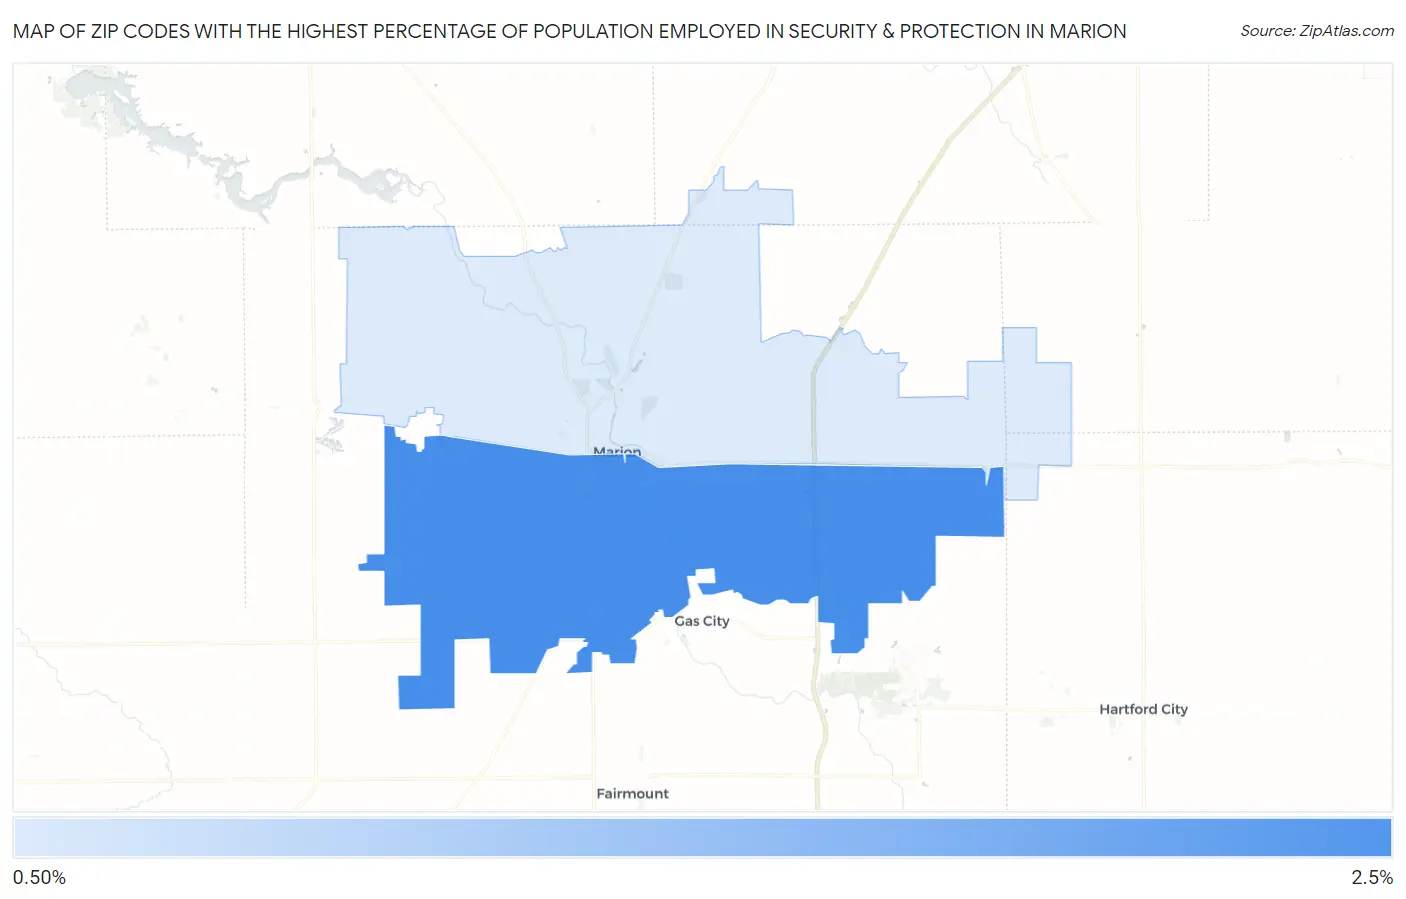
Map of Zip Codes with the Highest Percentage of Population Employed in Security & Protection in Marion
1.3%
2.1%
Zip Codes with the Highest Percentage of Population Employed in Security & Protection in Marion, IN
| Zip Code | % Employed | vs State | vs National | |
| 1. | 46953 | 2.1% | 1.8%(+0.288)#239 | 2.1%(-0.086)#12,166 |
| 2. | 46952 | 1.3% | 1.8%(-0.459)#409 | 2.1%(-0.833)#17,612 |
1
Common Questions
What are the Top Zip Codes with the Highest Percentage of Population Employed in Security & Protection in Marion, IN?
Top Zip Codes with the Highest Percentage of Population Employed in Security & Protection in Marion, IN are:
What zip code has the Highest Percentage of Population Employed in Security & Protection in Marion, IN?
46953 has the Highest Percentage of Population Employed in Security & Protection in Marion, IN with 2.1%.
What is the Percentage of Population Employed in Security & Protection in Indiana?
Percentage of Population Employed in Security & Protection in Indiana is 1.8%.
What is the Percentage of Population Employed in Security & Protection in the United States?
Percentage of Population Employed in Security & Protection in the United States is 2.1%.