Zip Codes with the Highest Percentage of Population Employed in Agriculture, Fishing & Hunting in Tinley Park, IL
RELATED REPORTS & OPTIONS
Agriculture, Fishing & Hunting
Tinley Park
Compare Zip Codes
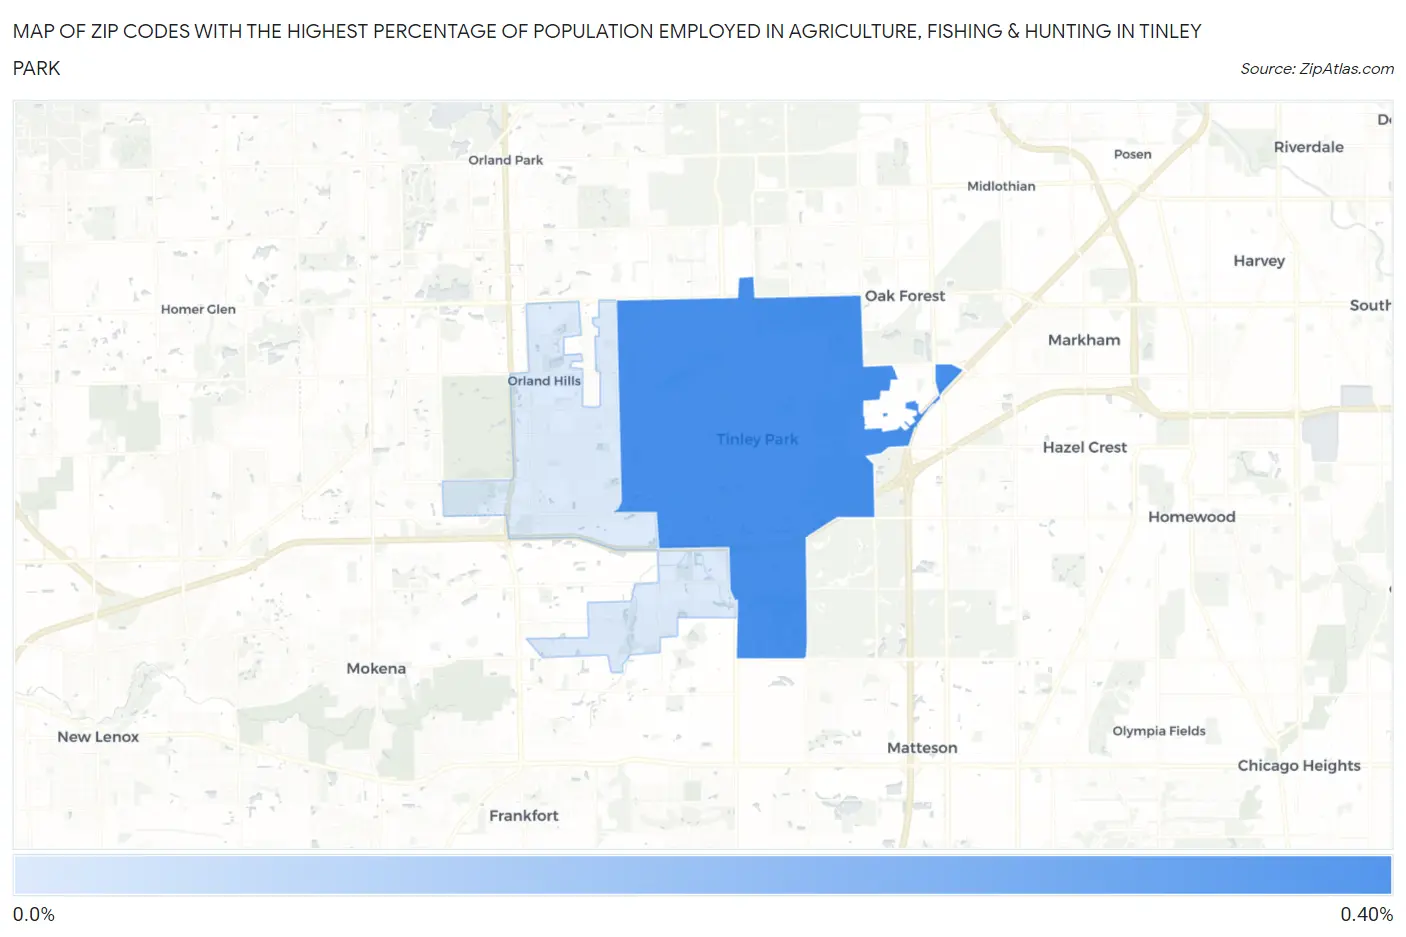
Map of Zip Codes with the Highest Percentage of Population Employed in Agriculture, Fishing & Hunting in Tinley Park
0.028%
0.32%
Zip Codes with the Highest Percentage of Population Employed in Agriculture, Fishing & Hunting in Tinley Park, IL
| Zip Code | % Employed | vs State | vs National | |
| 1. | 60477 | 0.32% | 0.88%(-0.561)#966 | 1.2%(-0.883)#20,986 |
| 2. | 60487 | 0.028% | 0.88%(-0.850)#1,131 | 1.2%(-1.17)#24,541 |
1
Common Questions
What are the Top Zip Codes with the Highest Percentage of Population Employed in Agriculture, Fishing & Hunting in Tinley Park, IL?
Top Zip Codes with the Highest Percentage of Population Employed in Agriculture, Fishing & Hunting in Tinley Park, IL are:
What zip code has the Highest Percentage of Population Employed in Agriculture, Fishing & Hunting in Tinley Park, IL?
60477 has the Highest Percentage of Population Employed in Agriculture, Fishing & Hunting in Tinley Park, IL with 0.32%.
What is the Percentage of Population Employed in Agriculture, Fishing & Hunting in Tinley Park, IL?
Percentage of Population Employed in Agriculture, Fishing & Hunting in Tinley Park is 0.22%.
What is the Percentage of Population Employed in Agriculture, Fishing & Hunting in Illinois?
Percentage of Population Employed in Agriculture, Fishing & Hunting in Illinois is 0.88%.
What is the Percentage of Population Employed in Agriculture, Fishing & Hunting in the United States?
Percentage of Population Employed in Agriculture, Fishing & Hunting in the United States is 1.2%.