Zip Codes with the Highest Percentage of Population with a Degree in Arts and Humanities in Belleville, IL
RELATED REPORTS & OPTIONS
Arts and Humanities
Belleville
Compare Zip Codes
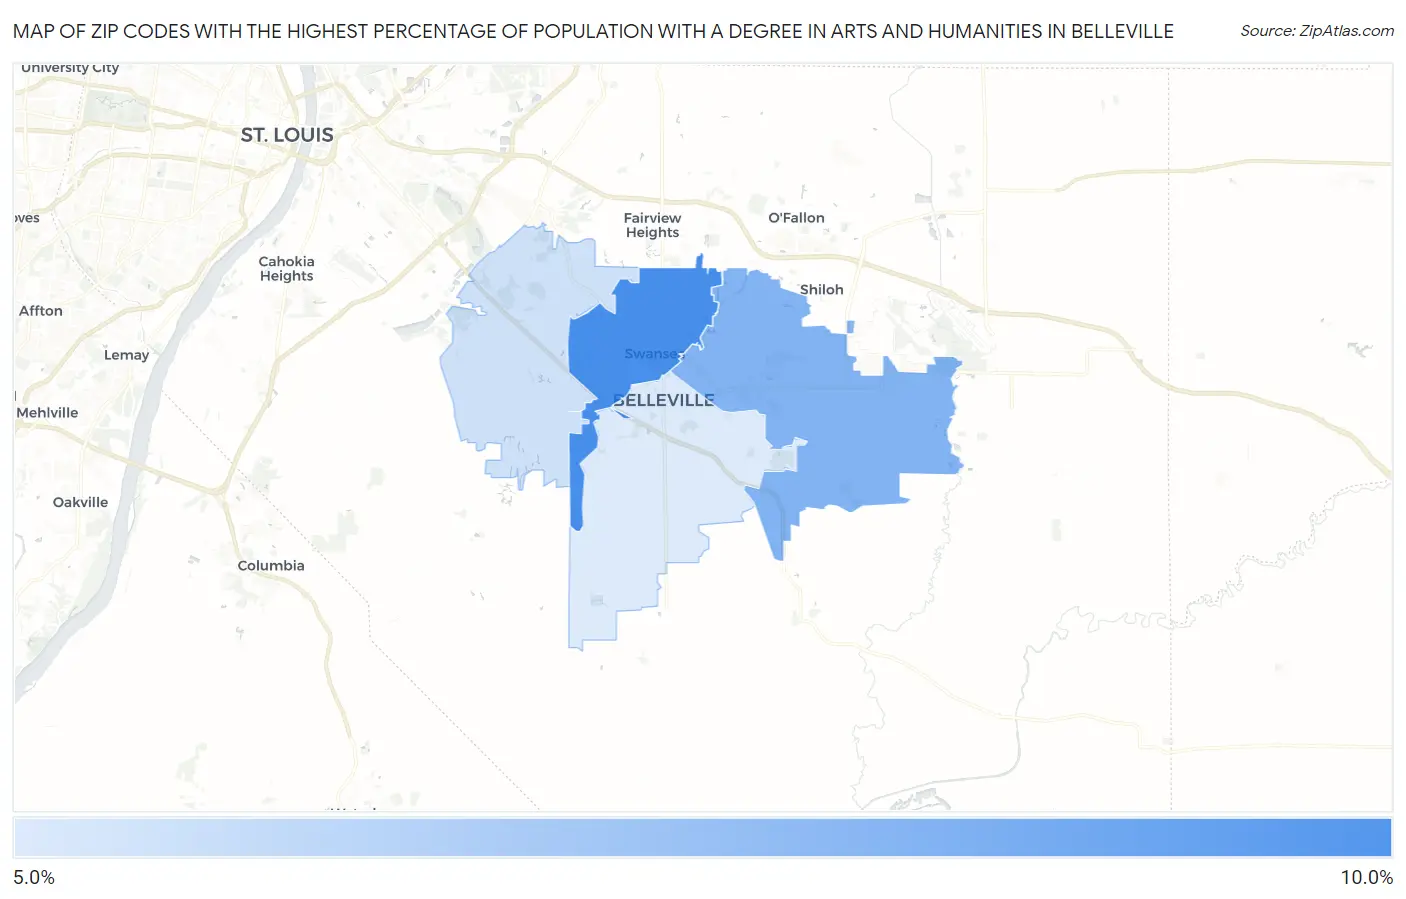
Map of Zip Codes with the Highest Percentage of Population with a Degree in Arts and Humanities in Belleville
5.6%
9.9%
Zip Codes with the Highest Percentage of Population with a Degree in Arts and Humanities in Belleville, IL
| Zip Code | % Graduates | vs State | vs National | |
| 1. | 62226 | 9.9% | 5.5%(+4.40)#319 | 6.0%(+3.89)#6,400 |
| 2. | 62221 | 8.2% | 5.5%(+2.74)#431 | 6.0%(+2.24)#9,154 |
| 3. | 62223 | 6.0% | 5.5%(+0.512)#635 | 6.0%(+0.010)#14,654 |
| 4. | 62220 | 5.6% | 5.5%(+0.103)#680 | 6.0%(-0.399)#15,858 |
1
Common Questions
What are the Top 3 Zip Codes with the Highest Percentage of Population with a Degree in Arts and Humanities in Belleville, IL?
Top 3 Zip Codes with the Highest Percentage of Population with a Degree in Arts and Humanities in Belleville, IL are:
What zip code has the Highest Percentage of Population with a Degree in Arts and Humanities in Belleville, IL?
62226 has the Highest Percentage of Population with a Degree in Arts and Humanities in Belleville, IL with 9.9%.
What is the Percentage of Population with a Degree in Arts and Humanities in Belleville, IL?
Percentage of Population with a Degree in Arts and Humanities in Belleville is 8.6%.
What is the Percentage of Population with a Degree in Arts and Humanities in Illinois?
Percentage of Population with a Degree in Arts and Humanities in Illinois is 5.5%.
What is the Percentage of Population with a Degree in Arts and Humanities in the United States?
Percentage of Population with a Degree in Arts and Humanities in the United States is 6.0%.