Zip Codes with the Highest Percentage of Population with a Degree in Arts and Humanities in Glenview, IL
RELATED REPORTS & OPTIONS
Arts and Humanities
Glenview
Compare Zip Codes
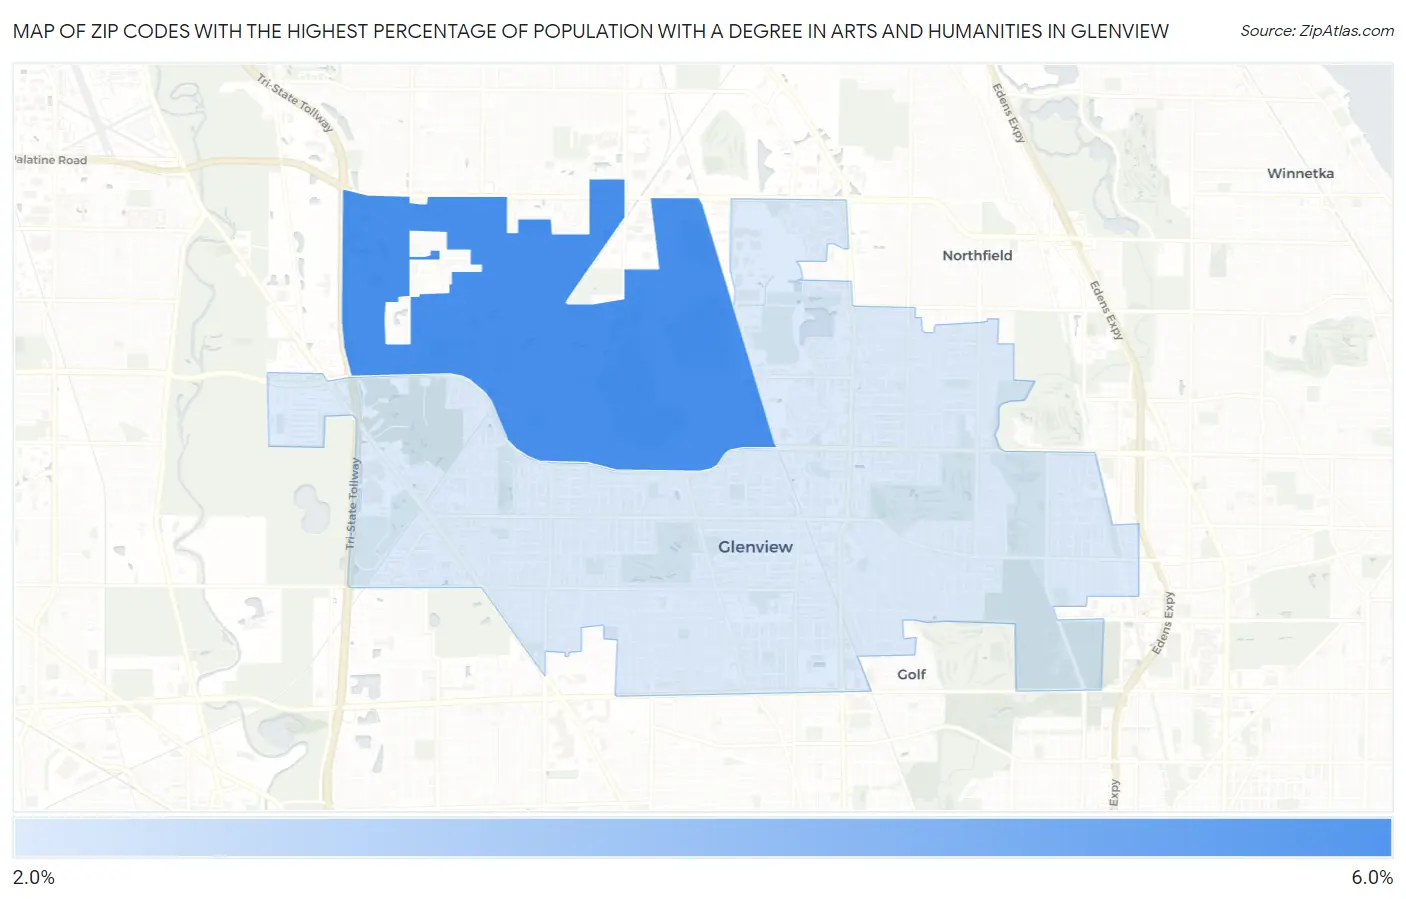
Map of Zip Codes with the Highest Percentage of Population with a Degree in Arts and Humanities in Glenview
2.7%
5.8%
Zip Codes with the Highest Percentage of Population with a Degree in Arts and Humanities in Glenview, IL
| Zip Code | % Graduates | vs State | vs National | |
| 1. | 60026 | 5.8% | 5.5%(+0.320)#660 | 6.0%(-0.182)#15,203 |
| 2. | 60025 | 2.7% | 5.5%(-2.78)#994 | 6.0%(-3.28)#23,192 |
1
Common Questions
What are the Top Zip Codes with the Highest Percentage of Population with a Degree in Arts and Humanities in Glenview, IL?
Top Zip Codes with the Highest Percentage of Population with a Degree in Arts and Humanities in Glenview, IL are:
What zip code has the Highest Percentage of Population with a Degree in Arts and Humanities in Glenview, IL?
60026 has the Highest Percentage of Population with a Degree in Arts and Humanities in Glenview, IL with 5.8%.
What is the Percentage of Population with a Degree in Arts and Humanities in Glenview, IL?
Percentage of Population with a Degree in Arts and Humanities in Glenview is 3.6%.
What is the Percentage of Population with a Degree in Arts and Humanities in Illinois?
Percentage of Population with a Degree in Arts and Humanities in Illinois is 5.5%.
What is the Percentage of Population with a Degree in Arts and Humanities in the United States?
Percentage of Population with a Degree in Arts and Humanities in the United States is 6.0%.