Zip Codes with the Highest Percentage of Population Employed in Installation, Maintenance & Repair in Orland Park, IL
RELATED REPORTS & OPTIONS
Installation, Maintenance & Repair
Orland Park
Compare Zip Codes
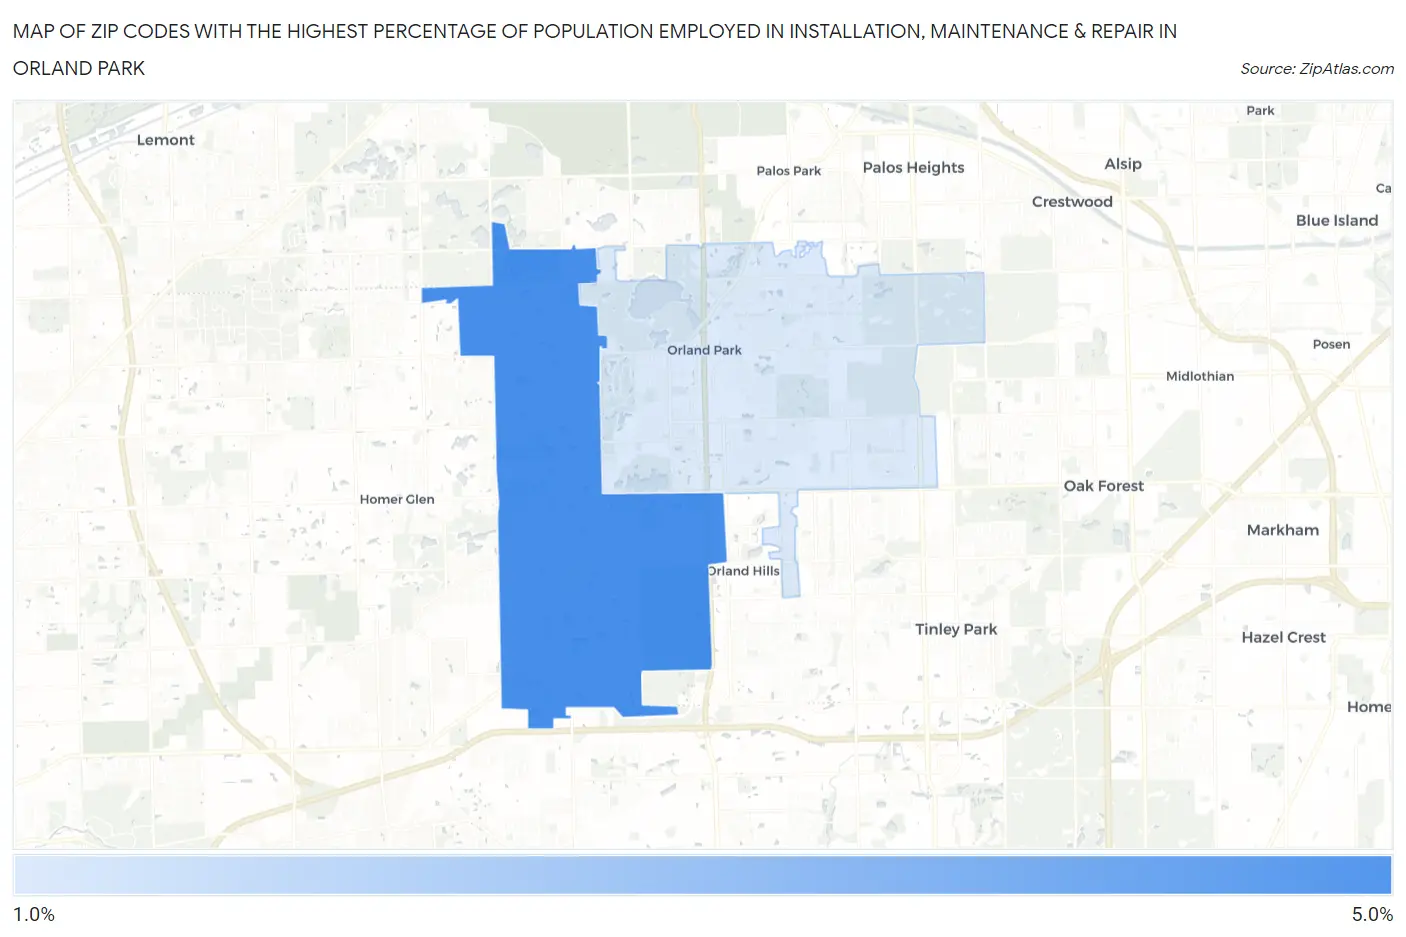
Map of Zip Codes with the Highest Percentage of Population Employed in Installation, Maintenance & Repair in Orland Park
1.4%
4.9%
Zip Codes with the Highest Percentage of Population Employed in Installation, Maintenance & Repair in Orland Park, IL
| Zip Code | % Employed | vs State | vs National | |
| 1. | 60467 | 4.9% | 2.7%(+2.14)#413 | 3.1%(+1.80)#9,162 |
| 2. | 60462 | 1.4% | 2.7%(-1.30)#1,097 | 3.1%(-1.64)#24,457 |
1
Common Questions
What are the Top Zip Codes with the Highest Percentage of Population Employed in Installation, Maintenance & Repair in Orland Park, IL?
Top Zip Codes with the Highest Percentage of Population Employed in Installation, Maintenance & Repair in Orland Park, IL are:
What zip code has the Highest Percentage of Population Employed in Installation, Maintenance & Repair in Orland Park, IL?
60467 has the Highest Percentage of Population Employed in Installation, Maintenance & Repair in Orland Park, IL with 4.9%.
What is the Percentage of Population Employed in Installation, Maintenance & Repair in Orland Park, IL?
Percentage of Population Employed in Installation, Maintenance & Repair in Orland Park is 2.0%.
What is the Percentage of Population Employed in Installation, Maintenance & Repair in Illinois?
Percentage of Population Employed in Installation, Maintenance & Repair in Illinois is 2.7%.
What is the Percentage of Population Employed in Installation, Maintenance & Repair in the United States?
Percentage of Population Employed in Installation, Maintenance & Repair in the United States is 3.1%.